Financial & Forex Market Recap: Nov. 16, 2026

On Nov. 16, 2026, a chip selloff before Nvidia’s earnings sank U.S. stocks, oil fell 3% on glut worries, and the Aussie led the majors lower.
Chip stocks dragged Wall Street lower again on Monday as traders braced for Nvidia’s first earnings report since Jensen Huang quit as CEO. The S&P 500 fell about 2%, and the risk-off mood likely hit the Australian and New Zealand dollars hardest. Oil dropped more than 3% on signs of a coming supply glut, and gold slid toward a one-year low as Fed hike bets held firm. The 10-year Treasury yield barely moved, and Bitcoin steadied after a weekend crash.
In short: On Monday, Nov. 16, 2026, a chip stock selloff ahead of Nvidia’s earnings pulled the S&P 500 down about 2.1% to near 7,420. WTI crude oil fell 3.2% to near $85.74 on supply glut worries, gold lost 0.9% to near $3,852, and the Australian dollar was the weakest major, down 0.6% to near 0.6735.
Monday’s Market Scoreboard: Stocks, Oil and Gold Fall as the Aussie Lags
| Asset | Close (approx.) | Day change | Driver |
|---|---|---|---|
| S&P 500 | 7,420 | -2.1% | Chip selloff before Nvidia earnings |
| U.S. 10-year yield | 5.13% | -0.1% (about -1 bp) | Small safe-haven bid |
| U.S. Dollar Index | 103.60 | +0.2% | Risk-off, Fed hike bets |
| WTI crude oil | $85.74 | -3.2% | Supply glut forecasts |
| Gold | $3,852 | -0.9% | Firm dollar, hike bets |
| Bitcoin | $65,000 | -0.6% | Calm after weekend liquidations |
| USD/JPY | 159.48 | -0.2% | Yen held up best |
| EUR/USD | 1.0999 | -0.2% | Broad dollar strength |
| GBP/USD | 1.3180 | -0.2% | Broad dollar strength |
| USD/CHF | 0.8403 | +0.1% | Franc mostly steady |
| AUD/USD | 0.6735 | -0.6% | Risk-off, weak China data |
| NZD/USD | 0.5499 | -0.5% | Risk-off, thin yield edge |
| USD/CAD | 1.4300 | +0.2% | Oil slide, soft CPI |
Approximate levels, 6:00 pm ET Sunday to 4:00 pm ET Monday. Drivers are likely factors, not confirmed causes.
Forex News Headlines & Data: China Data Miss, Japan GDP, Canada CPI and Warsh on AI
- New Zealand Services PSI for October 2026: 51.7 (50.9 previous)
- Japan GDP Growth Annualized Prel for Q3 2026: -0.1% (0.3% forecast; 1.1% previous)Below forecast
- GDP Growth Rate: 0.0% q/q (0.1% q/q forecast; 0.3% q/q previous)Below forecast
- Bank of Japan (BOJ) board member Hajime Takata called for an early rate hike and said the BOJ should raise rates nimbly rather than at a fixed pace
- China Industrial Production for October 2026: 4.8% y/y (5.3% forecast; 5.5% previous)Below forecast
- Retail Sales: 0.4% y/y (0.8% forecast; 1.1% previous)Below forecast
- Fixed Asset Investment (YTD): -8.1% y/y (-7.0% forecast; -7.2% previous)Below forecast
- Switzerland GDP Growth Rate Flash for Q3 2026: 0.2% q/q (1.5% q/q previous)
- Euro area Industrial Production for September 2026: -1.5% y/y (-0.2% forecast; -1.1% previous)Below forecast
- Industrial Production: 0.2% m/m (0.3% m/m forecast; -0.5% m/m previous)Below forecast
- European Central Bank (ECB) Vice President Boris Vujčić said AI and sovereign debt now stand out among the biggest risks to euro area financial stability
- Canada Inflation Rate for October 2026: 3.1% y/y (3.2% forecast; 3.1% previous)Below forecast
- Inflation Rate: 0.2% m/m (0.4% m/m forecast; 0.1% m/m previous)Below forecast
Why it mattered: Gasoline was the biggest upward driver, and prices outside energy rose just 2.0%, which may ease pressure on the Bank of Canada to keep tightening. The loonie dipped slightly right after the release.
- U.S. NY Empire State Manufacturing Index for November 2026: 7.8 (18.0 forecast; 25.5 previous)Below forecast
- The U.S. Commerce Department issued a rule to block Chinese companies from using advanced U.S. AI chips through data centers in other countries
- Federal Reserve Chair Kevin Warsh said AI could boost growth, push some workers out of jobs, or “disappoint” and drag stocks lower, and he gave no hint on near-term rates
- Bank of Canada Governor Tiff Macklem will not seek a second term when his term ends in June 2027
Broad Market Price Action: Chip Selloff Drags Stocks as Oil Slides
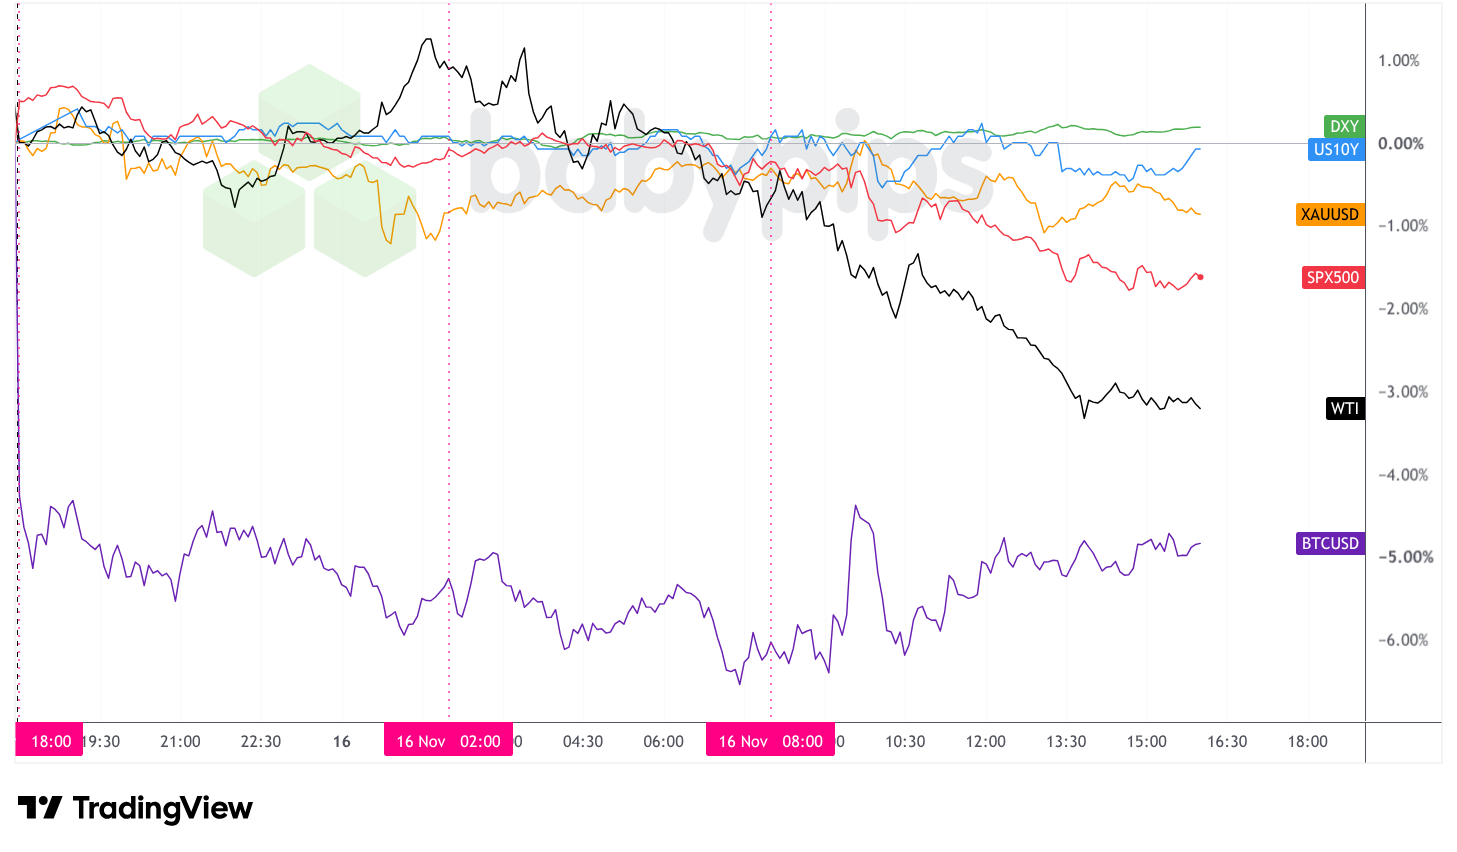
Chipmakers set the tone again. The cash S&P 500 fell 1.9% for its third straight loss, and the Nasdaq dropped 2.5%. Nvidia slid about 4%, while Intel, Micron, Marvell and Arm each fell more than 6% in afternoon trading. Traders likely cut risk before Nvidia’s results on Tuesday, its first report since Huang resigned last week. A new U.S. rule limiting China’s remote access to AI chips probably added to the selling, since it could squeeze chip sales to Chinese buyers. Warsh’s warning that AI returns could “disappoint” landed while stocks were already falling and may have fed the mood.
Treasuries got only a small safe-haven bid. The 10-year Treasury yield slipped about 1 basis point to near 5.13%, which suggests bond traders still expect the Fed to keep hiking. CME FedWatch showed about a 95% chance of a quarter-point hike in December on Monday afternoon.
Supply worries likely pushed oil lower. WTI fell about 3.2% to near $85.74 as tanker traffic through the Strait of Hormuz kept recovering. The International Energy Agency now sees a supply surplus this quarter, and Goldman Sachs expects Brent to slide to $78 by the end of 2027. Weak data from China and Europe probably added to demand worries, and an Iranian drone strike on a U.S. base in Bahrain on Sunday barely moved prices.
Gold didn’t get a safe-haven lift from the stock selloff. It fell about 0.9% to near $3,852 and touched its lowest level since October 2025 earlier in the day. A firm dollar and high odds of a Fed hike likely kept buyers away, because gold pays no interest when rates are rising.
Bitcoin did most of its damage over the weekend. It dropped to near $62,100 on Sunday, its lowest since July, as about $2 billion in crypto bets were forced closed. From Sunday evening, it slipped only about 0.6% to near $65,000, even as tech shares fell, which may mean much of the selling had already happened.
FX Market Behavior: U.S. Dollar vs. Majors
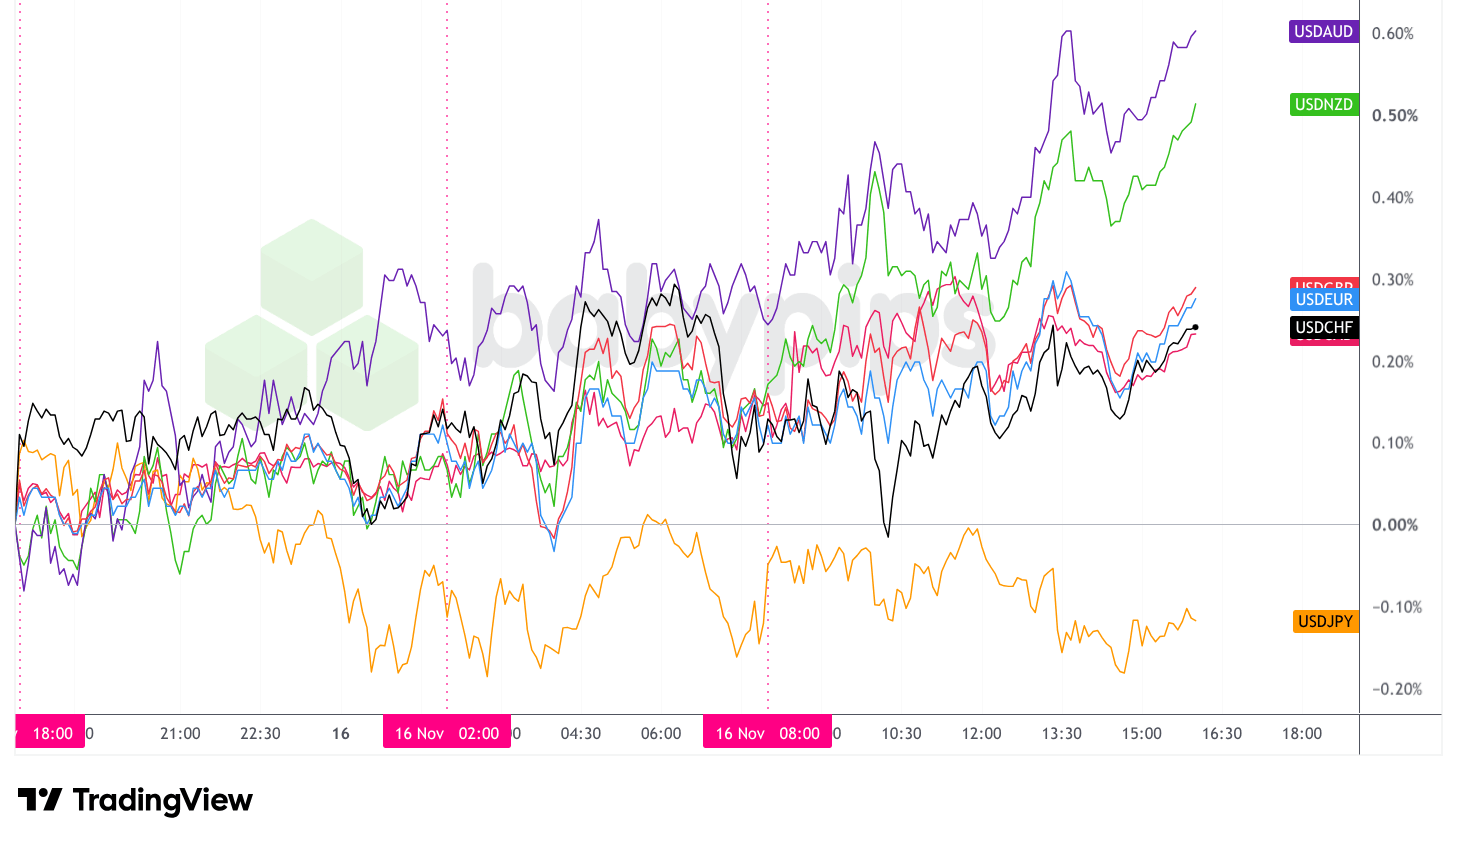
The U.S. dollar rose against six of the seven majors, and the Dollar Index added about 0.2% to near 103.60. The Australian dollar was the weakest major, down about 0.6% to near 0.6735, and the New Zealand dollar lost about 0.5%. The euro, pound and Canadian dollar each slipped about 0.2%, and the Swiss franc lost about 0.1%. The Japanese yen was the only major to gain, up about 0.2% against the dollar.
The Aussie and kiwi likely took the biggest hit from the risk-off mood. Both tend to fall when stocks drop, and China’s weak factory and retail data hurt the outlook for their biggest trading partner. They have also lost most of their yield edge. Australia’s 10-year bond now pays about the same as a Treasury, down from an 80 basis point premium in March, and New Zealand’s now pays less.
The yen likely benefited from safe-haven demand as stocks fell. Takata’s call for an early BOJ hike may also have helped. Japan’s economy shrank in the third quarter, but the yen shrugged it off. The Canadian dollar probably felt the oil slide, since crude is one of Canada’s biggest exports, and a slightly softer CPI print may have trimmed the case for more Bank of Canada hikes. The euro and pound mostly tracked the broad dollar, and a weak euro area industry report didn’t help.
Premium members got the Canada CPI Event Guide on Friday.
Market concept of the dayWhy Does a Shrinking Yield Gap Hurt the Aussie and Kiwi?
Big investors often hold a currency because its bonds pay more than U.S. bonds. That extra interest can cushion them when prices swing. Australia’s 10-year yield used to beat the Treasury yield by about 0.8 percentage point, but that gap is now near zero, so holding the Aussie pays little extra for the risk. When fear hits stocks, as it did on Monday, investors have less reason to stay, and both currencies can fall faster. You can learn how this works in How Bond Yields Affect Currency Movements in the School of Pipsology.
On Premium todayMonday’s Watchlist: Nasdaq 100 Analysis Before Nvidia’s Tuesday Report maps three scenarios for Nasdaq 100 futures into Nvidia’s results: Relief, Disappointment, and Yields or mixed. It also covers how Monday’s chip selloff changed the odds. It’s part of Babypips Premium.
Upcoming Potential Catalysts on the Economic Calendar: U.S. Retail Sales, Nvidia Earnings and U.K. Jobs
- U.S. Retail Sales for October 2026 at 1:30 pm GMT Tuesday, Nov. 17: forecasts range from 0.2% to 0.6% m/m after 0.8% in September. A strong print could firm up December Fed hike bets and support the dollar.
- Nvidia third-quarter earnings at about 9:20 pm GMT Tuesday, Nov. 17: Wall Street expects about $109.5 billion in revenue. The outlook could decide whether the chip selloff spreads or fades.
- U.K. Unemployment Rate for September 2026 at 7:00 am GMT Tuesday, Nov. 17: economists expect 4.7%, the same as last time, with regular pay growth seen easing to 3.6% from 3.7%. Softer wages could weigh on Bank of England hike bets.
Also on the calendar (GMT):
- Australia RBA Meeting Minutes at 12:30 am GMT Tuesday
- New Zealand RBNZ Inflation Expectations for Q4 2026 at 2:00 am GMT Tuesday
- Germany ZEW Economic Sentiment for November 2026 at 10:00 am GMT Tuesday
- Canada Housing Starts for October 2026 at 1:15 pm GMT Tuesday
- U.S. Industrial Production for October 2026 at 2:15 pm GMT Tuesday
- U.S. NAHB Housing Market Index for November 2026 at 3:00 pm GMT Tuesday
- Japan Balance of Trade for October 2026 at 11:50 pm GMT Tuesday
Tuesday may decide whether Monday’s chip selloff spreads or fades. Retail sales will test how firmly the Fed is set on a December hike, and Nvidia’s outlook after the New York close could set the tone for stocks, the Aussie and Bitcoin into Wednesday’s Fed minutes.
Prefer email updates? The Babypips Daily Newsletter sends market news and trading best practices to your inbox.
Stay frosty out there, forex friends!