Chart Art: Gold (XAU/USD) Eyes Bullish Breakout Ahead of U.S. CPI


Gold’s rebound faces a major test as XAU/USD approaches neckline resistance, with U.S. inflation data threatening to shake things up.
Gold bugs, are you ready for a breakout?
XAU/USD is flashing a potential bullish reversal pattern, but there’s a big resistance hurdle standing in the way.
With U.S. CPI just around the corner, could this be the catalyst that sends gold charging toward $4,200?
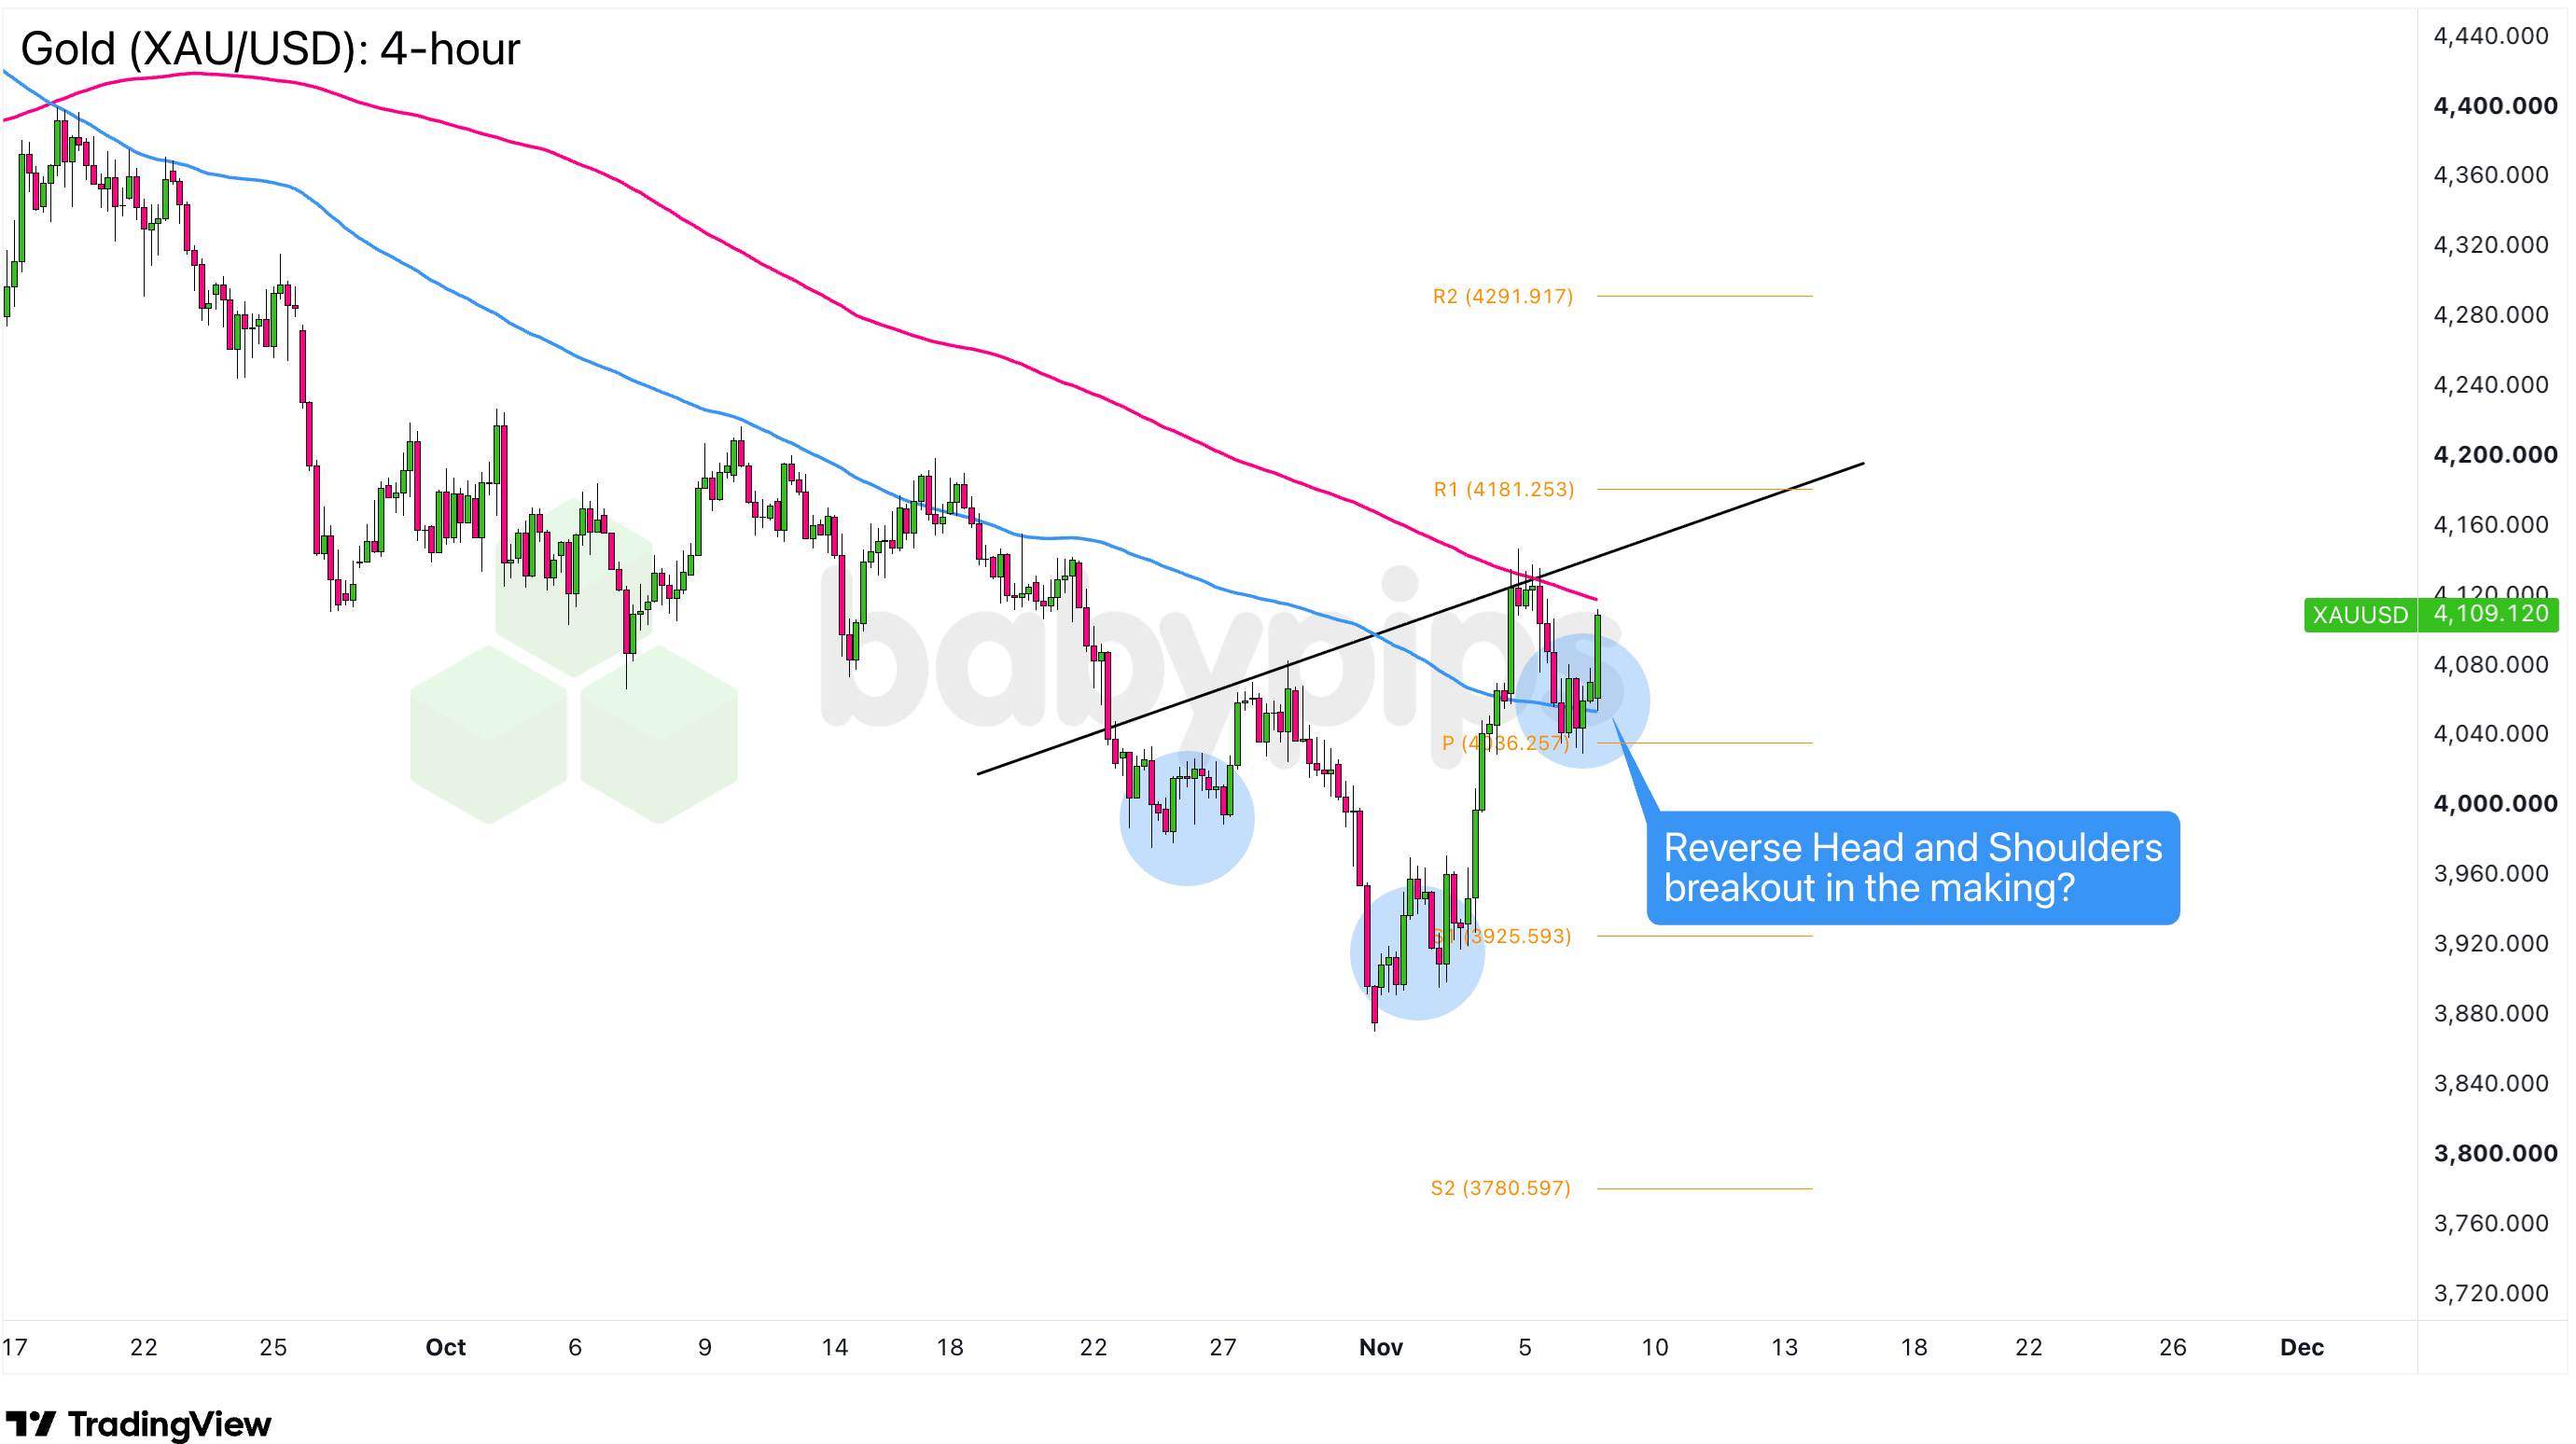
Gold (XAU/USD): 4-hour
Gold surprised traders last week, rallying even as an AI-driven selloff hammered chip stocks and pushed the Nasdaq into correction territory. Safe-haven demand tied to U.S.-Iran tensions, falling Treasury yields, and AI spending worries likely helped gold rebound from its one-year lows.
Tuesday’s U.S. CPI report takes center stage, with markets pricing in roughly 78% odds of a December Fed rate hike after last week’s blowout jobs report. Softer inflation could cool those bets, weigh on the dollar, and lift gold, while a hotter print could boost the Greenback and send gold back toward or below $4,000. U.S.-Iran headlines and earnings from CoreWeave, Cisco, and Applied Materials could also shake up risk sentiment.
On the 4-hour chart, XAU/USD is shaping up a potential inverse Head and Shoulders pattern, with the head near $3,900 and both shoulders forming at higher levels. Gold has since bounced back and is now testing a resistance cluster around $4,120, where the neckline, descending 200 SMA, and psychological level converge.
Watch for bullish candlestick patterns around $4,120. A clean break and close above the “neckline” and 200 SMA could confirm the bullish breakout and open the door to the R1 Pivot Point ($4,181), followed by the $4,200 psychological level.
On the flip side, a rejection at the neckline and 200 SMA could send gold back toward the Pivot Point ($4,036). A sharper selloff, especially if CPI comes in hotter than expected, could put the $4,000 handle back in play.
Whichever bias you end up trading, don’t forget to practice proper risk management and stay aware of top-tier catalysts that could influence overall market sentiment!
Disclaimer: This article is for educational purposes only. It isn’t investment or trading advice or a recommendation to buy or sell anything. Your trading decisions, including how much to risk, are your own.
AI disclosure: The Babypips editorial team used AI tools to help research, write, and check this article. A Babypips editor reviewed and edited it before publication. AI tools can misread data, make arithmetic errors, and state wrong information in a confident tone. Check figures and quotes against the linked sources before you rely on them. Our Editorial Policy explains how we create and review our content.
Related Articles
- General News
Gold Is Testing $4,000 — Could These 10 Mining Stocks Rebound First?
- Forex News
TA Alert of the Day: XAG/USD Selling Pressure Intensifies as RSI Drops Below 30
- Stock Markets News
Stocks end higher as CoreWeave results ease AI spending worries
- Forex News
Financial & Forex Market Recap: Nov. 10, 2026
- General News
US Indices Start the Week on a Strong Footing as Oil Drops More Than 6%