TA Alert of the Day: XAG/USD Selling Pressure Intensifies as RSI Drops Below 30


XAG/USD drops sharply as RSI falls below 30, signaling oversold conditions. Could a rebound develop, or might the downtrend continue?
Article Highlights
- Silver fell more than 3% in a single session, pushing the daily RSI below 30 and into oversold territory.
- Oversold doesn’t guarantee a bounce, so watch whether buyers can reclaim 55.00 or sellers push price toward 50.00.
- The bullish and bearish trade ideas each include entry, stop, and target levels, plus a small stop buffer for the breakout trades.
Silver took a big hit today.
XAG/USD dropped more than 3% and briefly slipped below 52.00 as the selling picked up.
The drop pushed momentum into oversold territory, so a short-term bounce is on the table.
The bigger downtrend is still intact though. Watch whether buyers defend the recent lows or sellers keep pushing.
What MarketMilk Has Detected
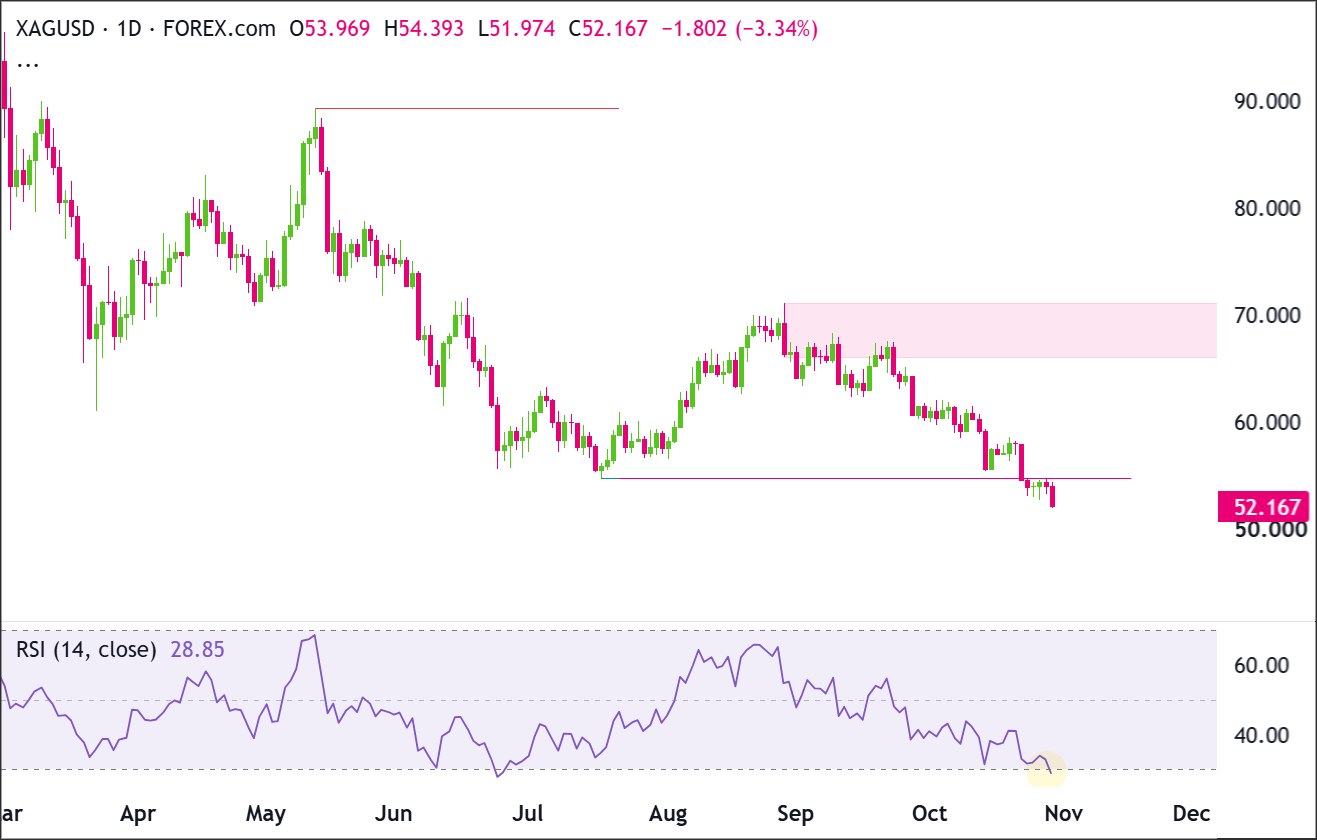
On the daily chart, MarketMilk detected the Relative Strength Index (RSI) falling below 30, which marks oversold conditions.
Silver has been in a downtrend since peaking near 89.00 in May, with a string of lower highs and lower lows.
This most recent leg down started from a lower high near 70.00 in late August.
What This Signals
An RSI reading below 30 means selling has been unusually heavy compared with recent price movement. Declines like that sometimes run out of steam and bounce.
But oversold doesn’t mean a reversal is coming. In a strong downtrend, RSI can sit below 30 for several sessions while price keeps falling.
For XAG/USD, two levels frame the picture.A rebound back above 54.60 to 55.00 would hint that buyers are getting a foothold.
A break below 52.00 would point to more downside.
What matters is whether price action backs up the RSI signal. Buyers showing up near support would support a bounce. Weak recoveries that get sold again would keep sellers in charge.
How It Works
The Relative Strength Index (RSI) is a momentum indicator. It compares the size of recent gains with the size of recent losses.
It runs from 0 to 100, and the extremes show when buying or selling pressure has stretched further than usual.
With the standard 14-period setting, traders usually read it like this.
- Below 30. The market is considered oversold, meaning selling pressure has been unusually strong.
- Above 70. The market is considered overbought, meaning buying pressure has been unusually strong.
Some traders treat an oversold reading as a possible buying opportunity, especially once RSI climbs back above 30 and price starts to recover.
The catch is that RSI doesn’t tell you when a reversal will happen.Combine it with price action, support and resistance, and other confirmation instead of trading it on its own.
What to Look For Before Acting
An oversold reading isn’t a buy signal by itself. Here’s what would show sellers running out of gas.
✅ A daily close above 53.00, which would put some distance between price and the lows near 52.00.
✅ A higher low above the 51.97 to 52.20 area. Sellers failing to make a new low is an early crack in the trend.
✅ A break back above 54.60 to 54.75, where price would be retaking former support.
✅ RSI climbing back above 30 and staying there.
✅ Bullish candlestick confirmation, such as a strong daily close near the session high.
✅ A rebound that holds its gains instead of fading as soon as sellers return.
✅ A move above 55.64, a previous turning point that could act as resistance.
✅ Confirmation from the weekly chart, to see whether the bigger downtrend is actually turning.
✅ Upcoming event risk, particularly U.S. inflation reports and central bank decisions. These can move silver through the U.S. dollar and interest rate expectations.
Risk Considerations
⚠️ Oversold can persist. Buying the first oversold reading in a strong downtrend often means getting in too early.
⚠️ Support breaks. A clean daily close below about 52.00 could speed up the selling and kill any hope of mean reversion (price snapping back after an extreme move).
⚠️ Whipsaw risk. RSI can pop back above 30 and still fail if price can’t reclaim 54.60 to 55.00.
⚠️ Volatility risk. Wide daily ranges like this one force wider stops and smaller position sizes.
Potential Next Steps
Add XAG/USD to your watchlist and see how price behaves now that it has broken below its previous swing low around 55.00.
Price Action Analysis
XAG/USD remains in a clear downtrend, with lower highs and lower lows since its May peak near 89.00. Every rally attempt lately has been sold.
The question now is whether XAG/USD can get back above 55.00 or keeps sliding toward the psychological 50.00 level.
A bounce from oversold wouldn’t be surprising, but buyers need to prove themselves before a bigger recovery looks likely.
Trade Idea: Bullish Scenario
Setup
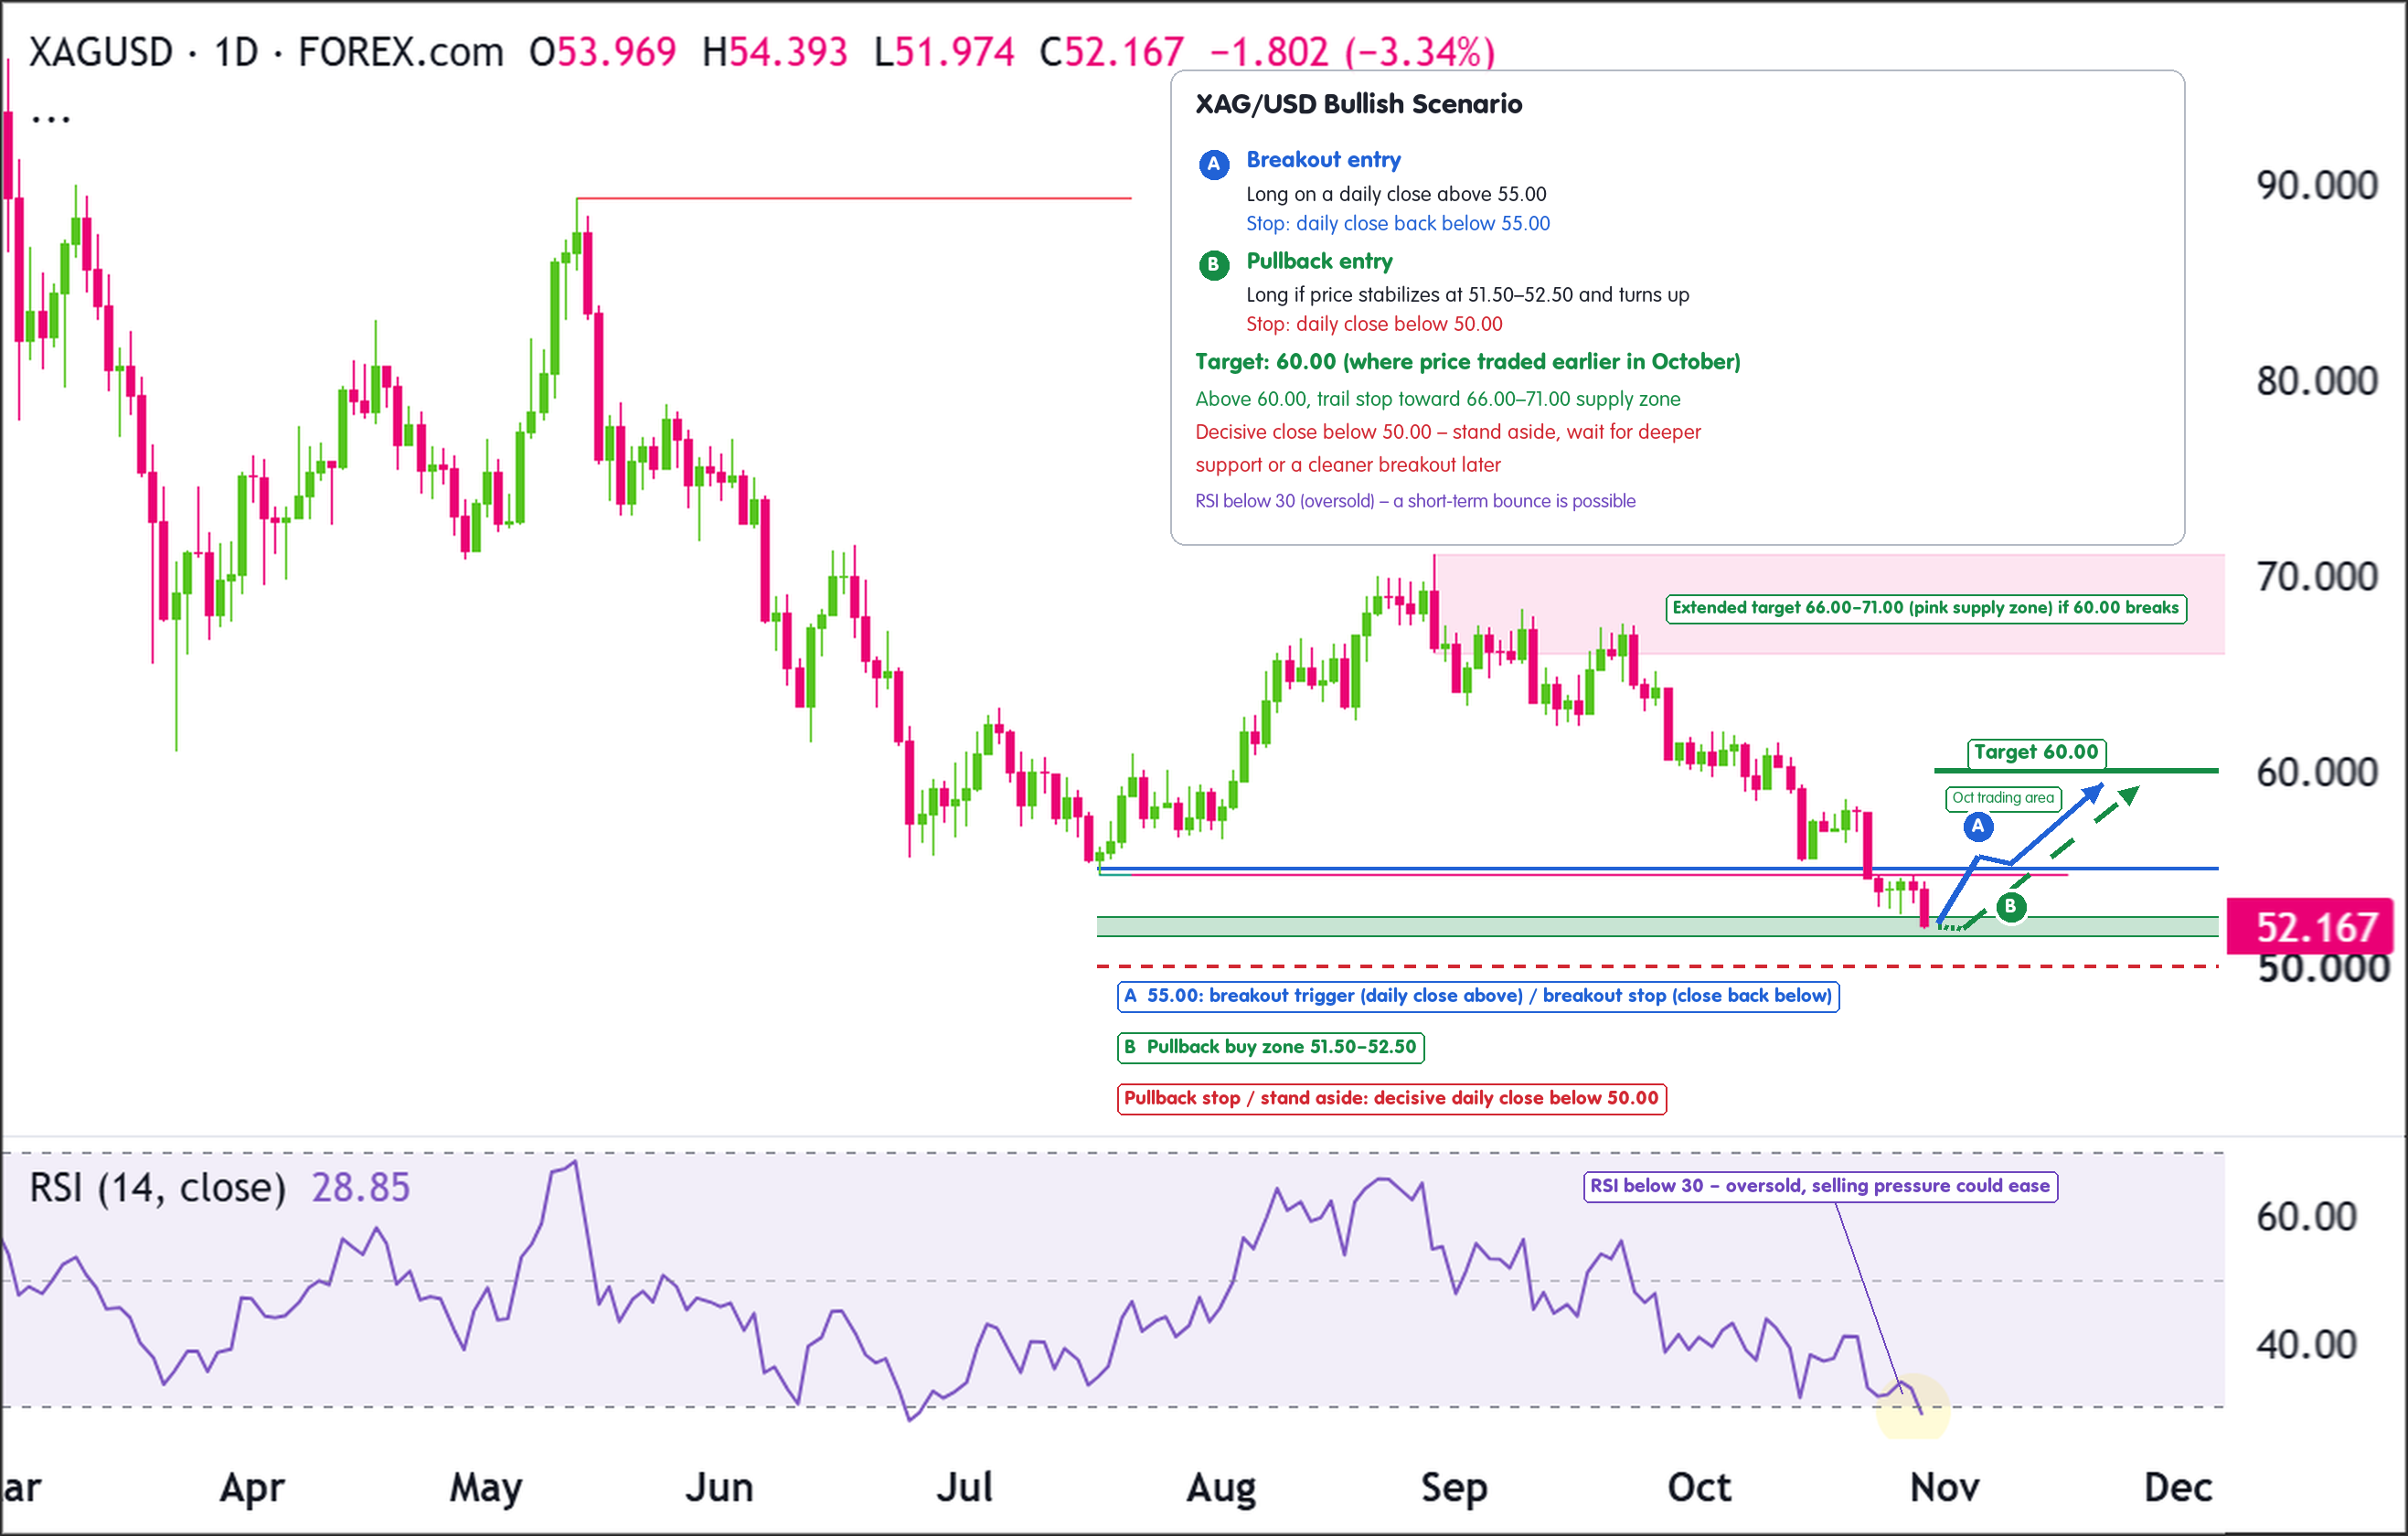
The bullish case needs XAG/USD to find a floor after this decline and show buyers stepping back in. The oversold RSI gives that some chance.
The first area to watch is 51.50 to 52.50, where price was trading when the alert fired. It isn’t proven support yet, so buyers have to steady price here and start lifting it.
The bigger test is 55.00. A recovery above it would mean price has retaken the swing low that just failed as support.
Holding above 55.00 could clear the way toward 60.00, where price traded earlier in October.
Entry
One option is to go long on a daily close above 55.00, once buyers have taken back that old support.
The other is to buy in the 51.50 to 52.50 zone if price stabilizes there and turns higher.
If price instead closes decisively below 50.00, stand aside and wait for deeper support or a cleaner breakout later.
Stop Loss
For breakout entries, exit on a daily close back below 55.00. A close back under that level means the breakout didn’t stick.
That puts the stop right on top of the entry, though. A little room, such as a close below 54.50, keeps one soft close from shaking you out.
For pullback entries, exit on a daily close below 50.00. Losing that level would show buyers can’t defend the area.
Take Profit
Target 60.00, the next important area above, where price traded before the latest decline.
If price gets there and keeps climbing, consider trailing your stop to see whether the recovery stretches toward the pink supply zone at 66.00 to 71.00.
Bottom Line
A bounce from oversold levels is possible, but the bullish case gets real only with a daily close above 55.00. That would put 60.00 in play as the next target.
A close below 50.00 would invalidate the setup and leave sellers firmly in control.
Trade Idea: Bearish Scenario
Setup
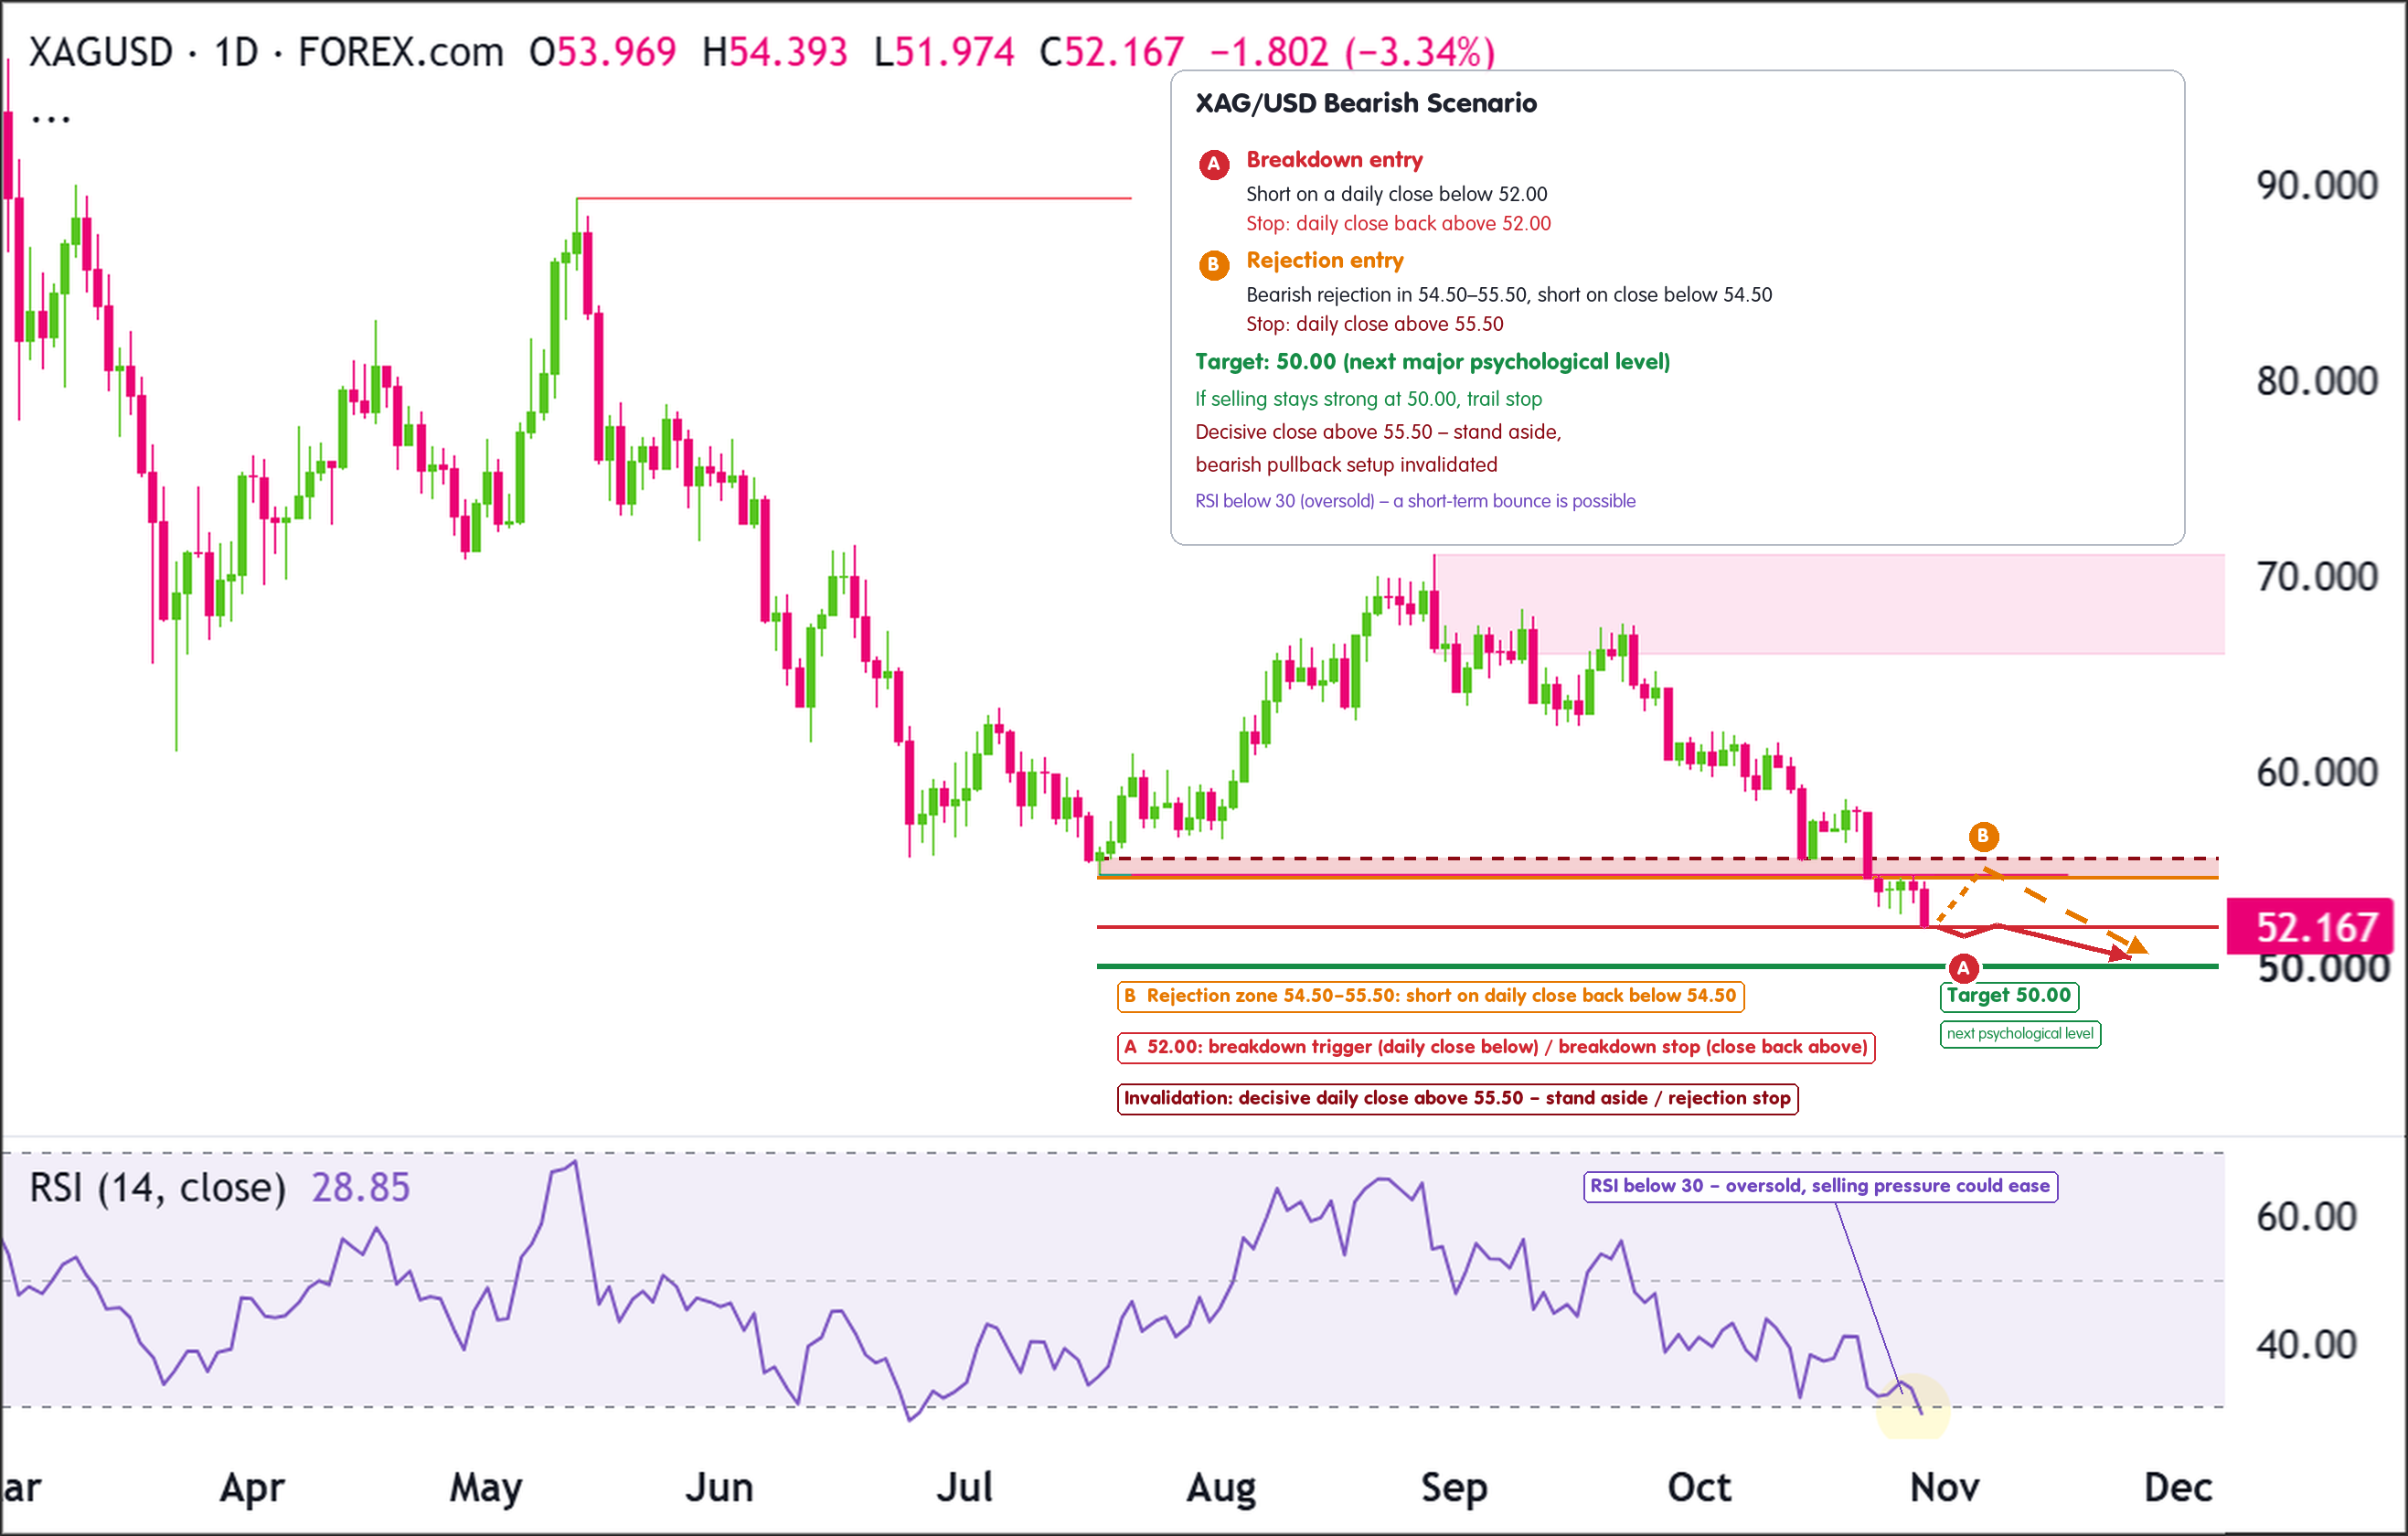
The bearish setup goes with the trend. XAG/USD broke below its previous swing low around 55.00, and the old support area at 54.50 to 55.50 could now act as resistance.
If an oversold bounce carries price up into that zone and stalls, sellers get a second chance to step in.
If XAG/USD keeps falling instead and closes below 52.00, the breakdown is still running and 50.00 comes into view.
Either way, the line in the sand is 55.00. As long as price stays under it, the bears have the edge.
Entry
Consider going short on a daily close below 52.00.
Alternatively, if price pushes into 54.50 to 55.50 and prints a clear bearish rejection candle, short the next daily close back below 54.50.
If price breaks and closes decisively above 55.50, stand aside. The pullback setup is off at that point.
Stop Loss
For breakdown entries, exit on a daily close back above 52.00, since price would have reclaimed the level it just broke.
Because entry and stop share the same level here, you may prefer some breathing room. Waiting for a close above 52.50 means a brief poke over 52.00 won’t end the trade.
For rejection entries near resistance, exit on a daily close above 55.50. That would mean buyers have pushed through the old support area.
Take Profit
Target 50.00. It’s the next major psychological level below, and a natural spot for buyers to try again.
If price reaches it and the selling doesn’t let up, you could trail your stop and see how far the downtrend runs.
Bottom Line
The bears hold the edge while XAG/USD trades below 54.50 to 55.50. A daily close below 52.00 would point toward 50.00 next.
RSI is already oversold, so expect the possibility of a short-term bounce along the way.
A close above 55.50 would invalidate the bearish pullback setup and suggest buyers are starting to take over.
Related Articles
- General News
Russell 2000 Stays Pegged by Trend Resistance and 200-Day MA
- Crypto News
3 Reasons Why Ethereum (ETH) Could Drop to $2,000
- Crypto News
Why XRP price could soon crash below $1 as dangerous pattern emerges
- Crypto News
XRP price prediction: Can XRP recover to $1.50 after October's decline?
- Crypto News
Can XRP price hold $1.26 as selling pressure builds?