Chart Art: AUD/CAD Trend Correction Approaches Confluence at .9800


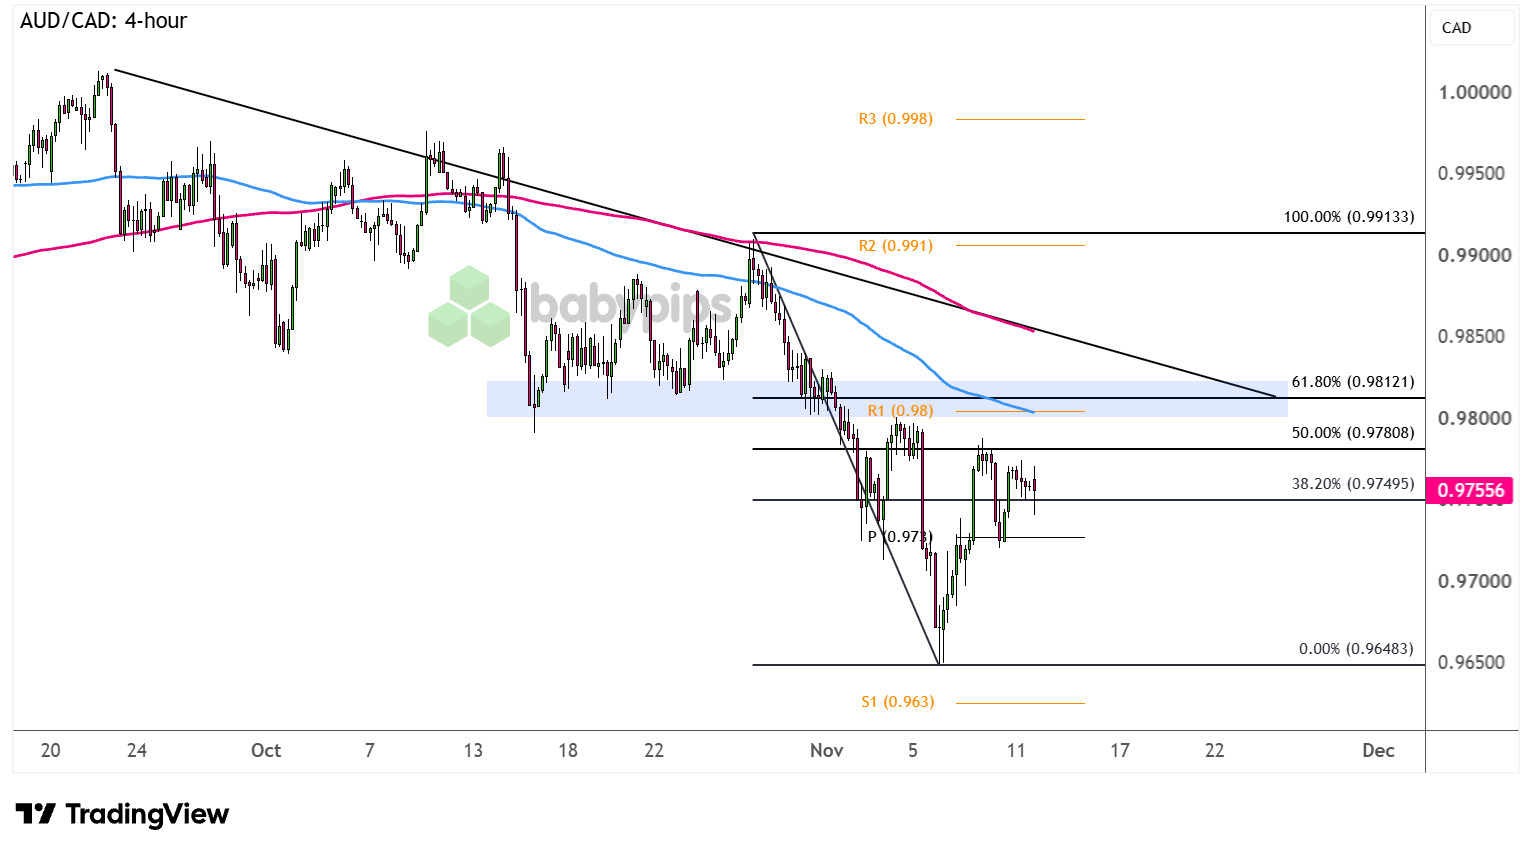
AUD/CAD has been cruising below a descending trend line for more than a month already, and it looks like another test is coming as it approaches the .9800 handle.
Better keep tabs on these potential resistance levels on the 4-hour time frame.
AUD/CAD: 4-hour
Rising crude oil prices, combined with a more hawkish Bank of Canada (BOC) tilt, have extended the Loonie’s rally over the past weeks.
However, China’s decision to extend their U.S. trade truce appears to have lifted the Aussie’s spirits on expectations of higher demand for Australia’s raw material commodities down the line.
Can the rebound for AUD/CAD last?
AUD/CAD is in correction mode as it tests the 50% Fibonacci retracement level at .9780, which could be enough to attract more sellers to resume the slide back to the swing low near the .9650 minor psychological mark.A larger pullback could still test the 61.8% Fib closer to the descending trend line, R1 (.9800), a former support zone, and the 100 SMA dynamic inflection point. Talk about confluence!
Reversal candlesticks at this area of interest could suggest a continuation of the downtrend while long green candles breaking higher could point to a potential uptrend.
In the latter scenario, keep your eyes peeled for sustained moves past the .9850 mark and 200 SMA dynamic resistance, possibly clearing the way for a rally to R2 (.9910) and beyond.
Whichever bias you end up trading, don’t forget to practice proper risk management and stay aware of top-tier catalysts that could influence overall market sentiment!
Btw, we’ve added a new prop firm directory to help you find firms that match your trading style.
Related Articles
- Forex News
Chart Art: USD/CAD Eyes Fresh Highs as Oil Selloff Weighs on CAD
- Forex News
Chart Art: CAD/JPY Tests Correction Levels Ahead of Canada’s Jobs Report
- Forex News
Speculator’s Australian Dollar Bets hit new bearish record. CAD, GBP & USD Index bets rise
- Forex News
Chart Art: Gold (XAU/USD) Eyes Bullish Breakout Ahead of U.S. CPI
- Stock Markets News
Before the Bell: What every Canadian investor needs to know today