Chart Art: USD/CAD Eyes Fresh Highs as Oil Selloff Weighs on CAD


Oil’s sharp selloff has lifted USD/CAD above a key resistance. Can buyers now defend this breakout and target higher inflection points?
Oil prices just suffered their biggest daily drop in months, and the Loonie is feeling the pressure.
With USD/CAD breaking above a key resistance cluster, could bulls be setting their sights on 1.4200?
We’re checkin’ out the daily chart!
USD/CAD: Daily
Crude oil tumbled more than 4% on Monday after President Trump said renewed strikes on Iran were “highly unlikely” if diplomatic progress continued, easing fears of supply disruptions. The selloff came ahead of Tuesday’s U.S. October CPI report, the final inflation reading before the Fed’s December meeting, with markets pricing in roughly an 83% chance of a rate hike of 25 basis points.
The oil slump spelled trouble for the Loonie, as Canada’s heavy reliance on energy exports makes its currency sensitive to falling crude prices. The commodity-related pressure helped offset broader U.S. dollar weakness, leaving CAD struggling even as most other major currencies gained ground against the Greenback.
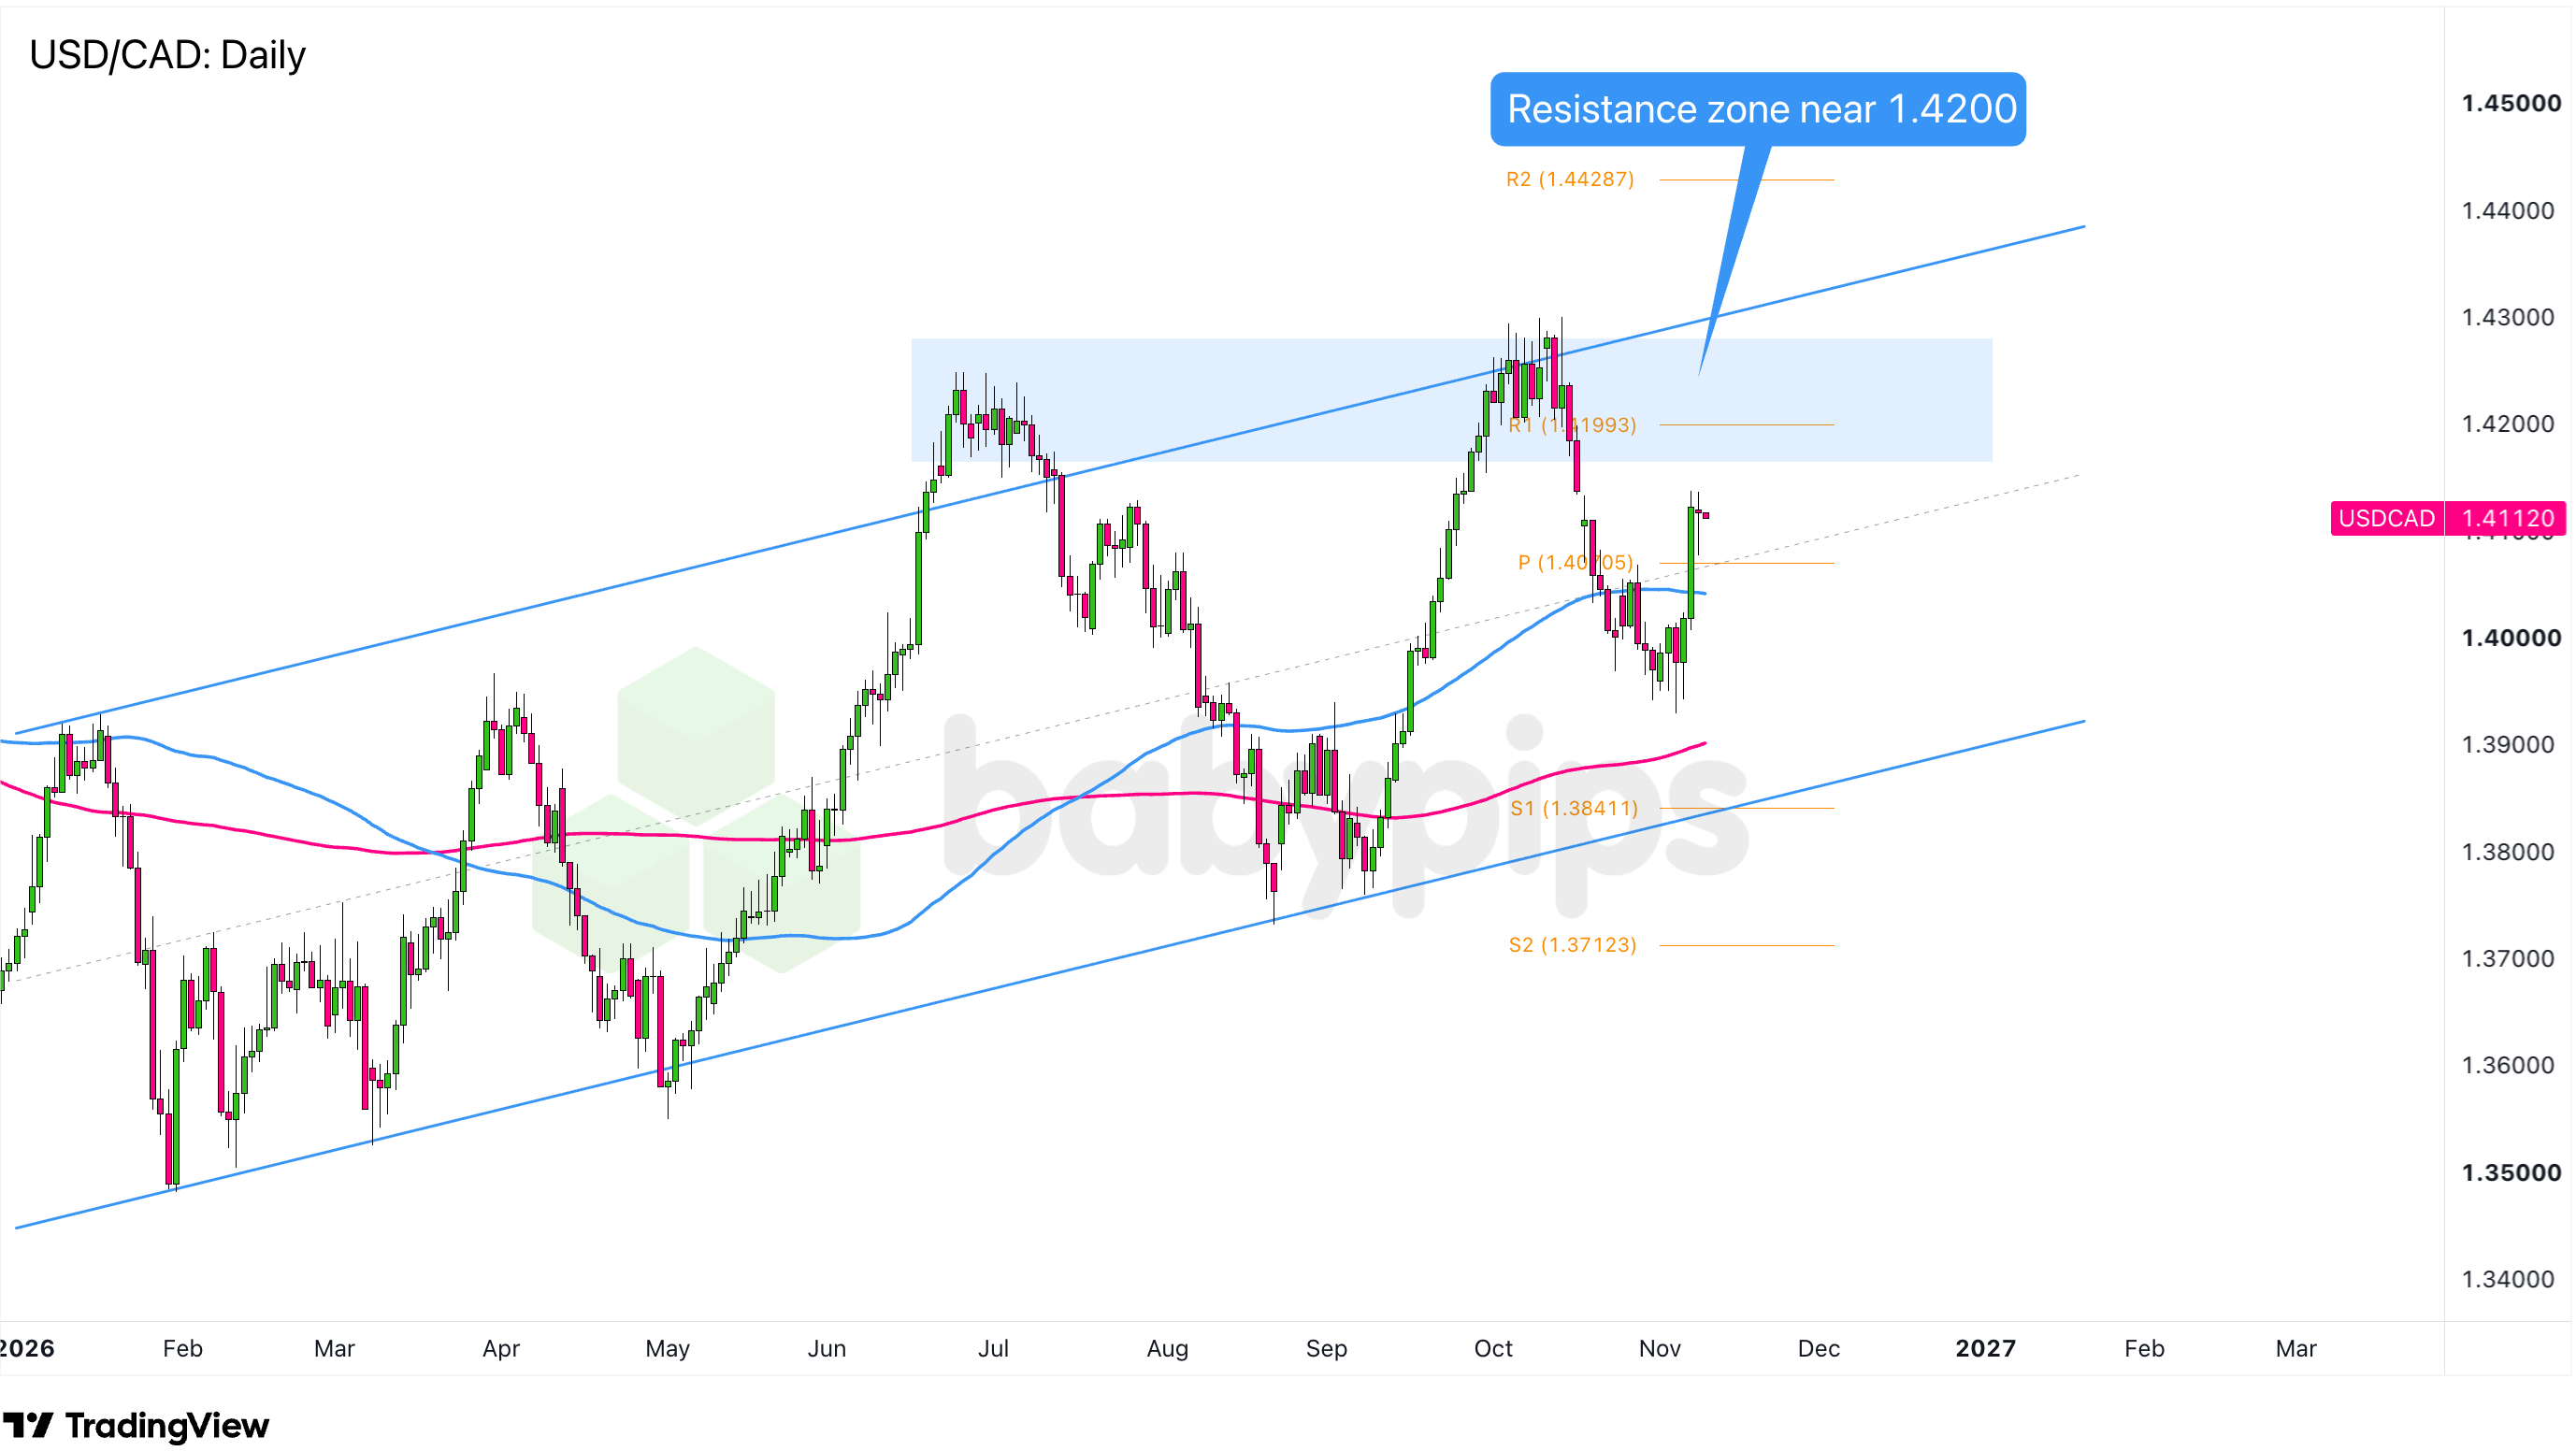
USD/CAD recently broke above the Pivot Point near 1.4005, an area that also lines up with the middle of an ascending channel pattern and the 100 SMA. That’s three former resistance levels now being tested as potential support!The pair is trading comfortably above the Pivot Point but still below the 1.4200 to 1.4300 resistance zone that kept a lid on gains back in October.
Watch for bullish candlestick patterns near the Pivot Point or the channel midpoint for clues that the breakout is holding. If buyers defend this area, USD/CAD could make a run for R1 near 1.4199, followed by the broader 1.4200 to 1.4300 resistance zone.
On the flip side, if USD/CAD slips back below the Pivot Point and channel midpoint, the 1.4000 psychological level becomes the next area to watch. A decisive break below that mark could open the door to S1 near 1.3841, which sits close to the ascending channel’s support zone. A move that far south would likely need a bigger catalyst, such as a surprisingly soft U.S. inflation report that cools Fed hike bets or a sharp rebound in oil prices that gives the Loonie a boost.
Whichever bias you end up trading, don’t forget to practice proper risk management and stay aware of top-tier catalysts that could influence overall market sentiment!
Btw, we’ve added a new prop firm directory to help you find firms that match your trading style.
Disclaimer: This article is for educational purposes only. It isn’t investment or trading advice or a recommendation to buy or sell anything. Your trading decisions, including how much to risk, are your own.
AI disclosure: The Babypips editorial team used AI tools to help research, write, and check this article. A Babypips editor reviewed and edited it before publication. AI tools can misread data, make arithmetic errors, and state wrong information in a confident tone. Check figures and quotes against the linked sources before you rely on them. Our Editorial Policy explains how we create and review our content.
Related Articles
- Stock Markets News
Canadian dollar steadies after posting longest daily winning streak in four years
- Stock Markets News
Before the Bell: What every Canadian investor needs to know today
- Stock Markets News
Before the Bell: What every Canadian investor needs to know today
- Stock Markets News
Before the Bell: What every Canadian investor needs to know today
- Forex News
Chart Art: AUD/CAD Trend Correction Approaches Confluence at .9800