Has the price of silver bottomed yet? Get ready for a reversal this spring
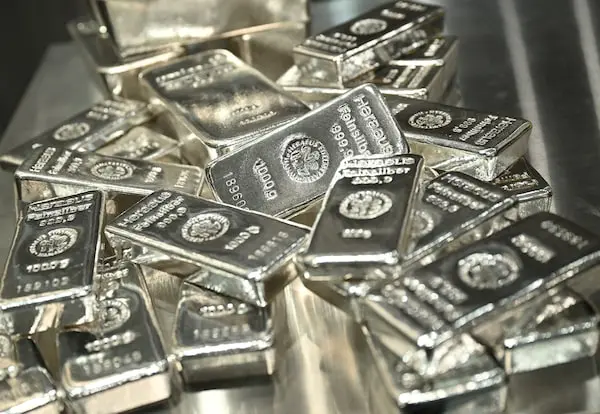
Interest rates, inflation and investor behaviour will determine whether the metal’s plunging value reverses
The price of silver dropped below US$50 per ounce last week and was trading around US$47 on Monday. In late January, silver exceeded US$120 per ounce for a brief time and has been on a downward trend since. What is driving the price of silver and where do we see it heading from here?
Why has the price of silver been dropping?
According to Marketscreener, the retreat reflects a reversal of speculative investment demand, easing physical shortages and a less favourable interest-rate outlook. The most recent Silver Institute/Metals Focus figures that were released on Nov. 12 provide a useful picture of the market, showing demand falling, mine production down slightly year over year and recycling up six per cent. The market balance (supply over demand) is also dropping, now at a projected 35-million ounce deficit in 2026. That’s down from a 54-million ounce deficit in 2025 and 124-million ounce deficit in 2024.
Supply and demand
Of the just over one billion ounces of silver produced annually, 80 per cent of it comes from mining, with the balance generated through recycling. Mexico, China, Peru, Chile and Bolivia are the top five countries by supply, generating just over 500 million ounces each year. Approximately 70 to 80 per cent of global silver output is produced as a by-product of mining for other metals – primarily copper, lead and zinc. Lead-zinc mines produce 32 per cent of that by-product output, while 25 per cent comes from copper mines.
This constrains supply, as silver production cannot respond quickly to higher prices. Only about 28 per cent of 2026 mine production is expected to come from primary silver mines. The rest depends heavily on production decisions made for other commodities, a relatively inelastic supply response.
The top five uses for silver (as a percentage of total demand) are industrial (42 per cent), photovoltaics (18 per cent), jewellery (18 per cent), coins/bars (15 per cent) and silverware (5 per cent). Central banks have no significant silver holdings.

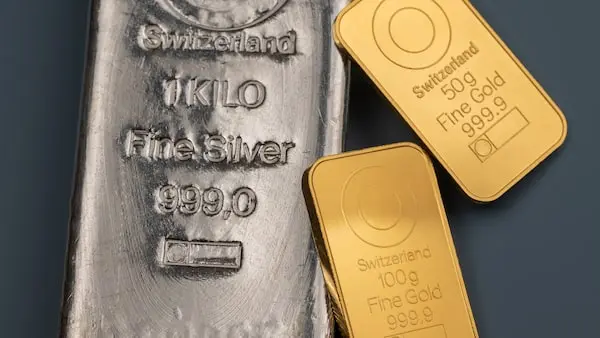
When real interest rates are below zero, the cost to hold silver, which does not pay any interest and therefore has no yield, is better than a negative real return on other assets.Angelika Warmuth/Reuters
Factors impacting the price of silver
Inflation and interest rates are critical: Higher real yields and a stronger U.S. dollar have been major obstacles to a price recovery. A sustained decline in U.S. 10-year real treasury yields would be one of the strongest signals of improving conditions for precious metals.
If inflation rises and interest rates remain relatively stable, or, even better, if inflation is subdued and interest rates gradually decline – the best environment for thesilver price – real interest rates fall.
When real interest rates are below zero (i.e. a negative yield), the cost to hold silver (or gold), which does not pay any interest and therefore has no yield, is better than a negative real return on other assets.
According to the CME Group’s FEDWatch tool, interest rates in the United States are expected to increase three more times by the spring, witha 94 per cent rate-hike probability in December. In Canada, three rate hikes are also expected, but spread out until fall. According to the Bank of Canada’s monetary policy report released on Oct. 28, inflation is projected to remain above 3 per cent through much of 2027 before easing back toward the 2 per cent target by mid-2028.
Silver is used both as an investment vehicle and industrial metal. Over the next few years, demand will be affected by several factors. For solar photovoltaic cells, installations will continue to grow, but silver consumption per cell is falling or being substituted. In electric vehicles and charging infrastructure, silver should have dependable structural growth. AI, data centres and advanced electronics foreshadow expanding demand, although precise silver consumption remains uncertain. Power grids and electrical equipment should see steady expansion with electrification and modernization. After exceptionally strong buying in 2025, silver-backed investment products are experiencing net outflows in 2026.
The gold-to-silver ratio
For those who like to follow the gold-to-silver ratio (the number of ounces of silver needed to purchase one ounce of gold), the long-term average is 60 to 65 ounces of silver to one ounce of gold, with the past five years having seen an average close to 80 and a current ratio at 78. When the average is above 60, silver is historically considered cheap relative to gold.
Where do analysts see the price going?
Looking at analyst forecasts over the next 12 months, we see a wide range of price expectations from as low as US$57 per ounce to as high as US$90. The majority of analysts I looked at are in the US$63-67 per ounce range.
Specifically, average annual price expectations per ounce for 2027 for the large banks are as follows: J.P. Morgan is at US$63.90, HSBC is at US$57, TD Economics shows US$67 and a recent poll from Reuters shows an average of US$66.75, down from US$70 per ounce in a poll for 2026 expectations done early in the year. Year-end targets for 2027 are higher with Commerzbank at US$80 per ounce and Citi at US$90.
Summary
Silver has a constructive long-term industrial demand story, but its price over the next one to two years will be determined primarily by interest rates, inflation and investor behaviour. Based on this analysis, we should expect continued pressure in the short term with a reversal starting in the spring.
Brian Donovan, CBV, is the president of StockCalc, a Canadian fintech based in Miramichi, N.B.