TA Alert of the Day: GBP/NZD Flashes a Bearish EMA Crossover


GBP/NZD flashes a bearish EMA crossover as its recent rally loses momentum. Could sellers push prices lower, or will buyers defend nearby support?
Article Highlights
- GBP/NZD’s daily chart shows a bearish crossover, with the 5 EMA dipping below the 20 EMA after the rally stalled near 2.3600-2.3650.
- The crossover hints that buying momentum is fading. A daily close below 2.3400 would favor sellers, and a close back above 2.3550 would point to a buyer recovery.
- EMA crossovers lag price and can whipsaw in sideways markets. Wait for price action to confirm before treating this one as a sell signal.
GBP/NZD‘s recent rally is starting to hit a speed bump.
After climbing toward multi-week highs, the pair has struggled to keep moving higher, and a fresh technical signal suggests buying momentum may be weakening.
The next few sessions could reveal whether sellers are gaining control or if this is just a temporary pause before buyers make another push higher.
What MarketMilk Has Detected
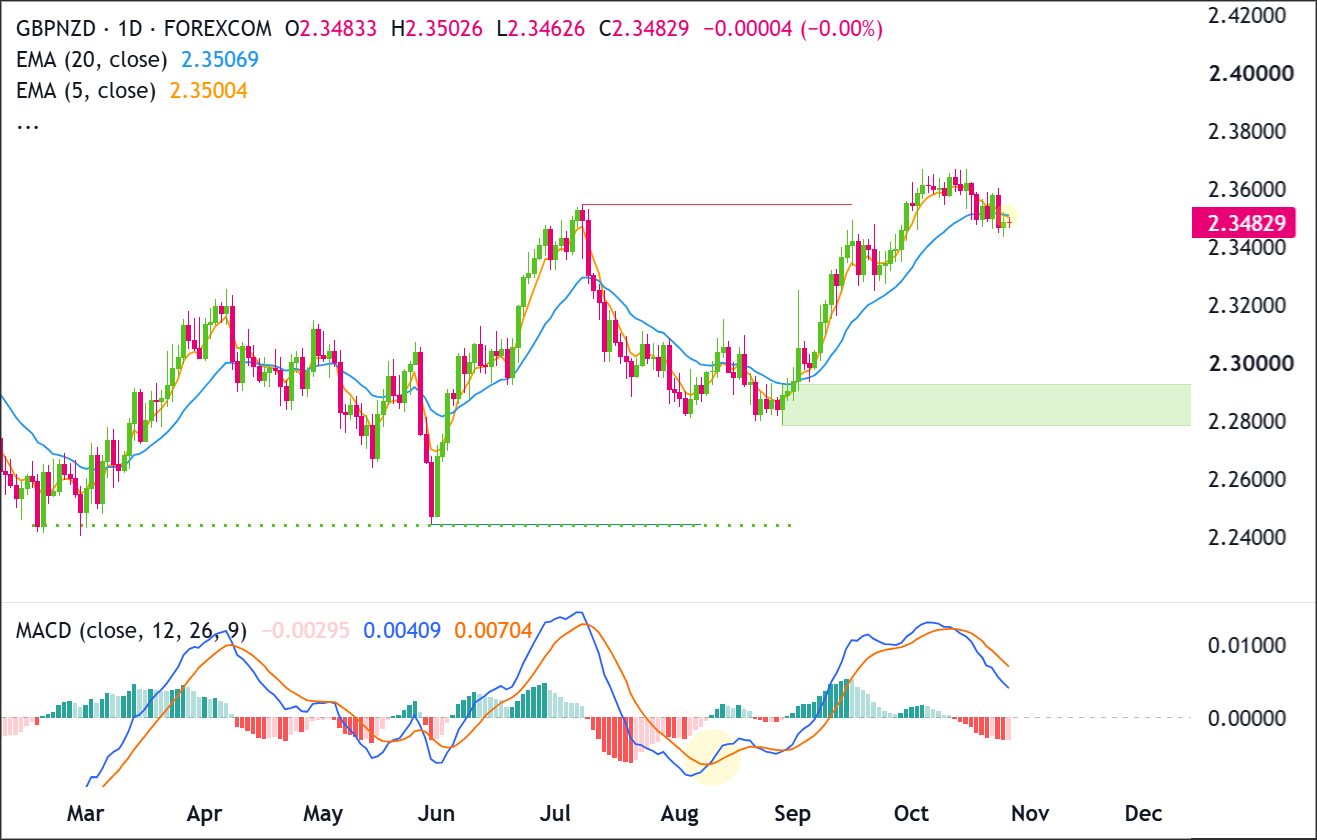
MarketMilk detected a bearish EMA crossover on GBP/NZD’s daily chart, with the 5 EMA crossing below the 20 EMA.
What This Signals
A 5 EMA crossing below the 20 EMA is commonly seen as a bearish signal.
It suggests that recent price momentum is weakening, which could lead to a deeper pullback or a period of sideways trading.
For GBP/NZD, the crossover comes after a strong rally that has recently struggled to make further progress.
If price continues trading below both EMAs and starts forming lower highs and lower lows, it could suggest that sellers are gaining control.
However, a bearish crossover doesn’t guarantee further declines. The two EMAs are still very close together, making this signal vulnerable to a quick reversal if buyers return.
If GBP/NZD climbs back above both averages and pushes toward the 2.3600-2.3650 resistance area, it could weaken the bearish outlook and suggest the recent pullback was only temporary.
For now, the crossover points to weakening short-term momentum, but further price action is needed to confirm whether a larger decline is developing.
How It Works
The Exponential Moving Average (EMA) helps you identify trends by tracking average prices over time.
It gives more weight to recent prices, making it quicker to respond to market changes than a simple moving average (SMA).
The 5 EMA follows recent price movements more closely, while the 20 EMA moves more slowly and reflects the broader trend.
When the 5 EMA crosses below the 20 EMA, it’s considered a bearish crossover.
This suggests that short-term momentum is weakening compared to the longer-term trend.
However, EMA crossovers are lagging signals because they’re based on past prices. They can also produce false signals when prices move sideways, causing the averages to cross back and forth.
That’s why it’s important to use EMA crossovers alongside price action and other technical signals rather than treating them as automatic buy or sell signals.
What to Look For Before Acting
Don’t assume the bearish EMA crossover is an automatic sell signal. Look for these signs of confirmation before making a trading decision.
✅ Daily closes. Does GBP/NZD continue closing below both the 5 EMA and 20 EMA? Or do buyers push price back above them?
✅ Lower highs and lower lows. Is price starting to form a series of lower highs and lower lows, suggesting sellers are gaining control?
✅ EMA retests. If GBP/NZD rebounds toward the moving averages, does it struggle to break above them, or can buyers reclaim both?
✅ Resistance levels. Does price remain below the 2.3600-2.3650 resistance area, or can buyers push through the recent highs?
✅ Higher timeframe trend. Does the weekly chart support further downside, or is the broader uptrend still intact?
✅ Volatility. Are daily price swings getting larger as GBP/NZD falls, or is the pair moving sideways without a clear direction?
✅ Economic events. Could upcoming Bank of England (BoE) or Reserve Bank of New Zealand (RBNZ) announcements, or major UK and New Zealand economic data, trigger sudden price swings?
Risk Considerations
⚠️ Whipsaw risk. Tight crossovers can reverse quickly if GBP/NZD remains range-bound.
⚠️ Lagging nature. The crossover may occur after a pullback is already well underway, reducing risk/reward if chased.
Potential Next Steps
Add GBP/NZD to a watchlist and watch whether it can climb back above 2.3550 or slips below 2.3400.
Price Action Analysis
Recent candles show buyers struggling to hold the move above 2.3550, following a rejection near 2.3600-2.3650.
The MACD has also turned lower. MACD is a momentum indicator that compares two moving averages, and its line has moved below its signal line. The red histogram bars suggest that selling momentum is picking up.
A daily close back above 2.3550 would be a first sign that buyers are recovering. A close below 2.3400 would suggest that sellers are gaining more control.
Trade Idea: Bullish Scenario
Setup
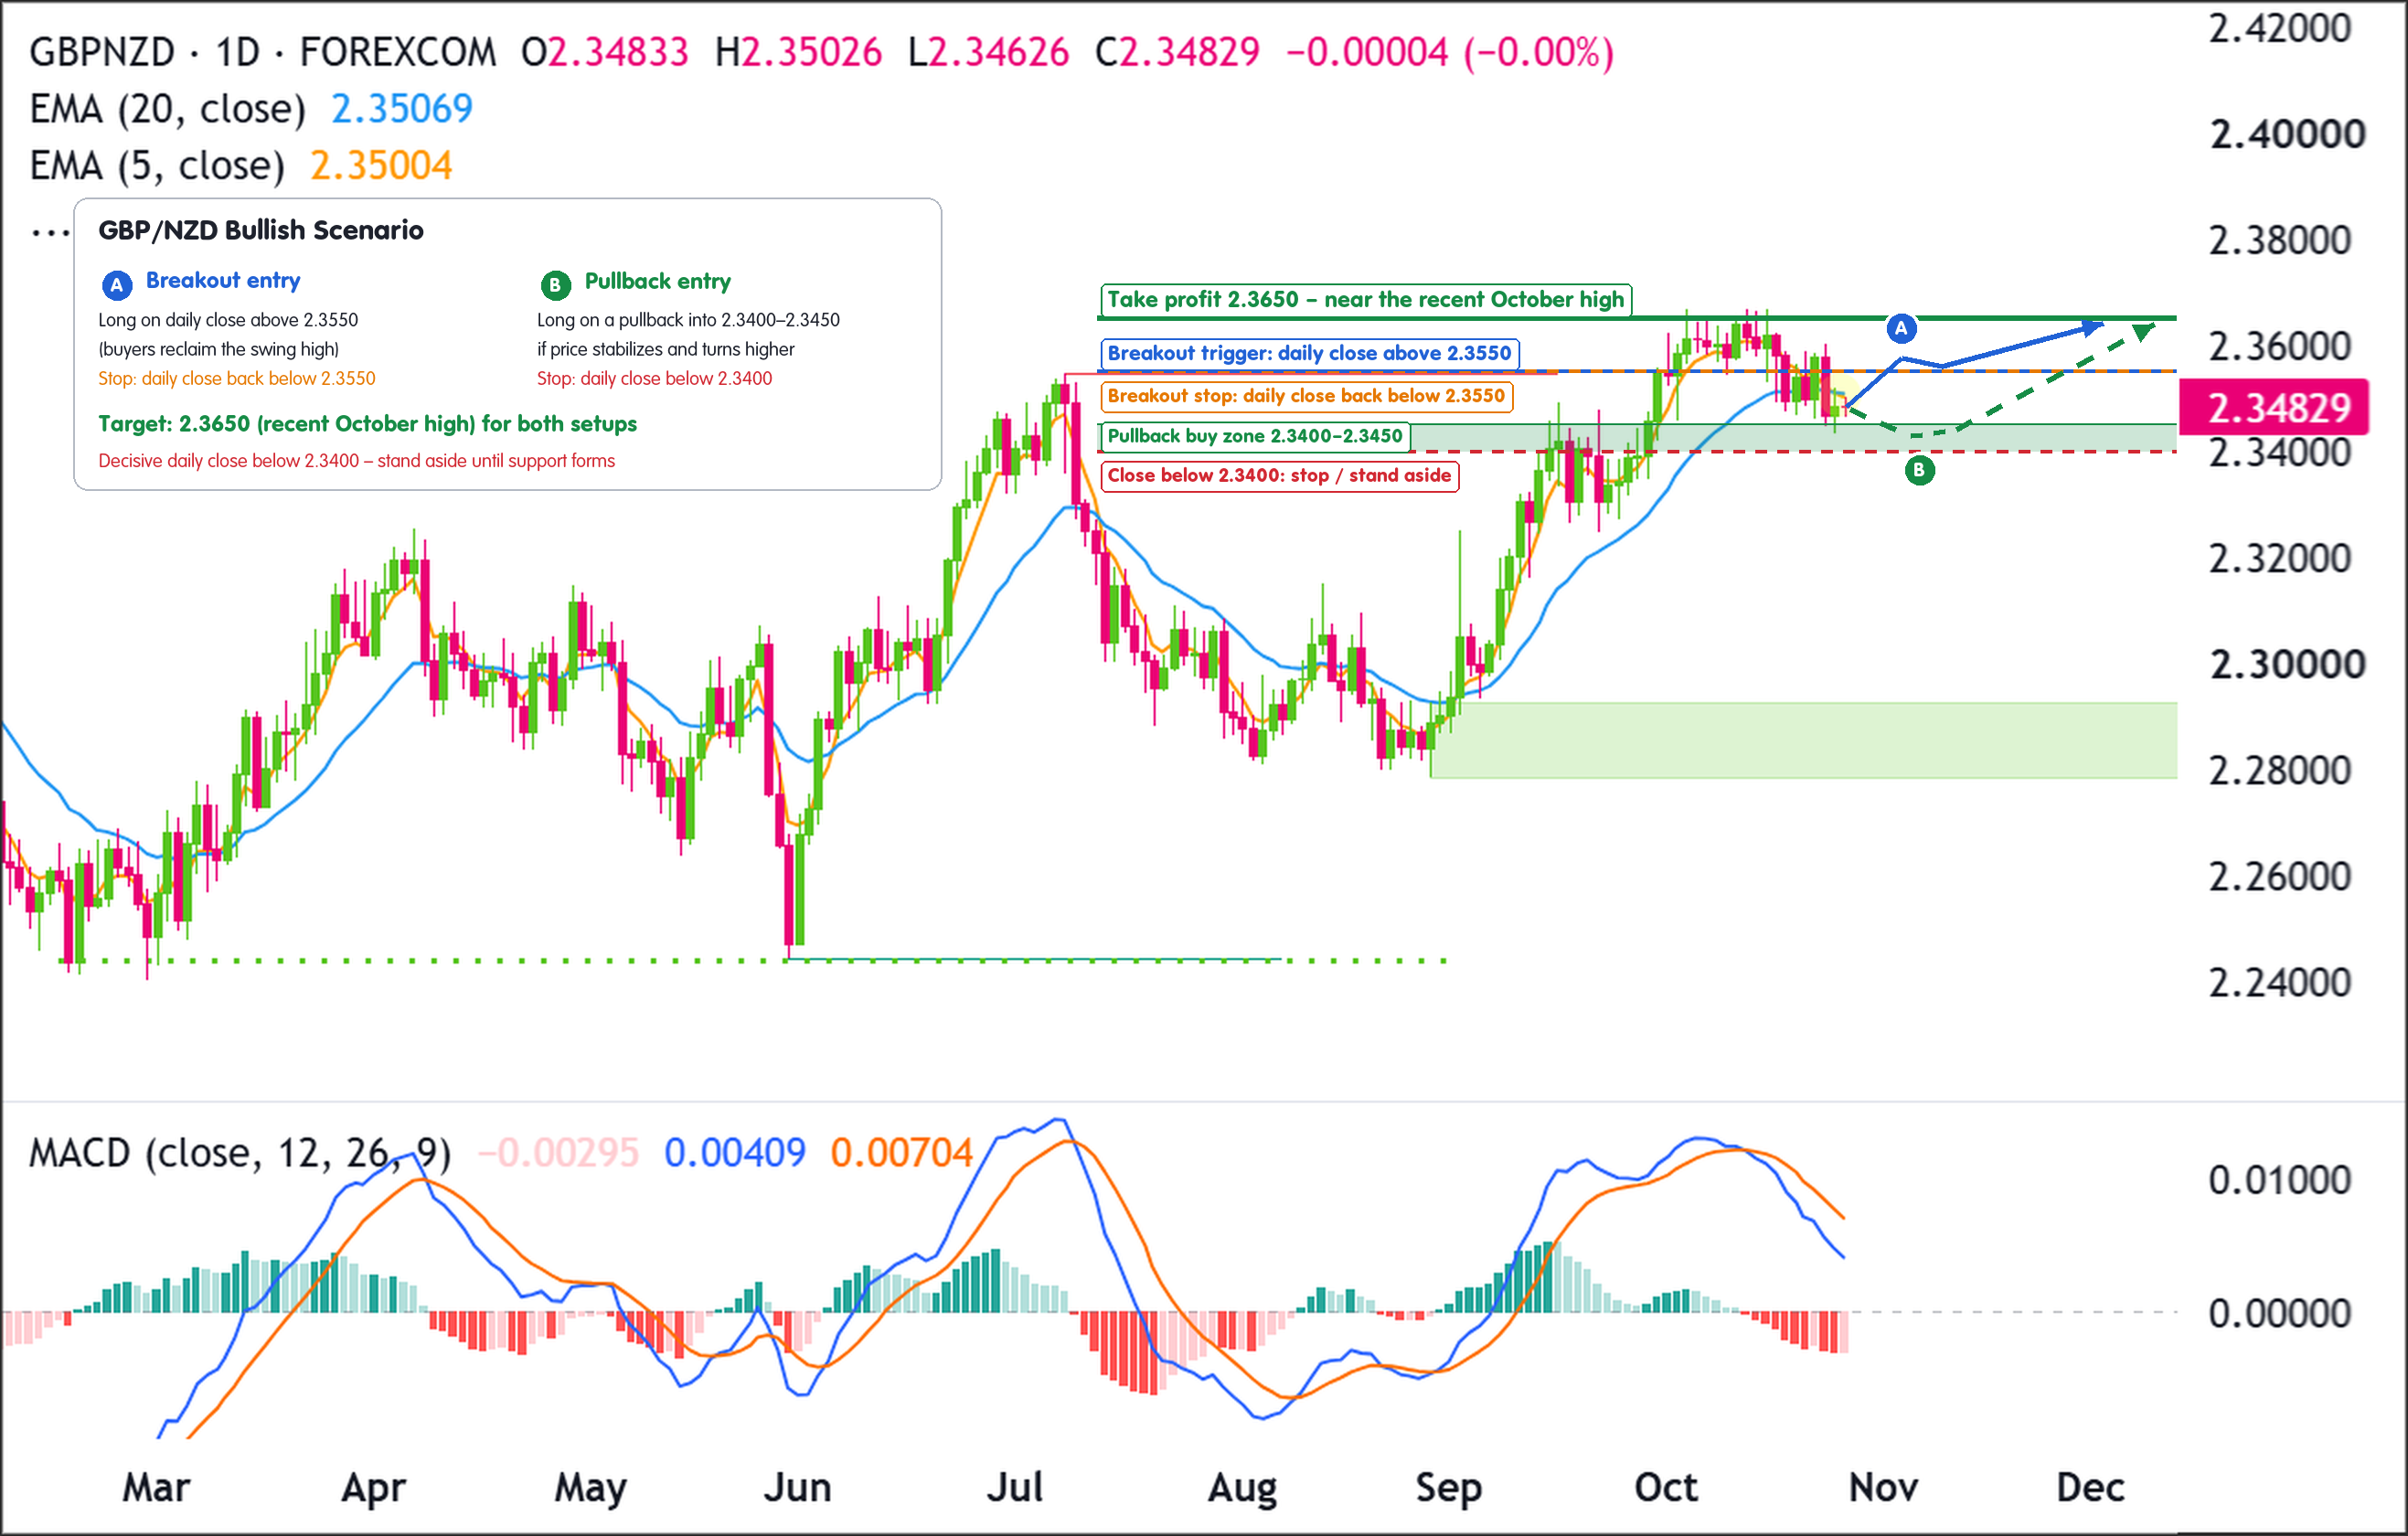
The bullish setup depends on GBP/NZD finding support around 2.3400-2.3450 and getting back above 2.3550. This would show buyers are defending the pullback and trying to restart the move toward the recent high near 2.3650.
Entry
Consider entering long on a daily close above 2.3550, confirming that buyers have reclaimed the previous swing high.
Alternatively, enter on a controlled pullback into 2.3400-2.3450 if price stabilizes there and starts turning higher.
If price closes decisively below 2.3400, stand aside and wait for a clearer sign that support is forming.
Stop Loss
For breakout entries, place the stop on a daily close back below 2.3550. This would show that buyers couldn’t hold above the level they just reclaimed.
For pullback entries, place the stop on a daily close below 2.3400. This would show that buyers are no longer defending the nearby support area.
Take Profit
Target 2.3650, near the recent October high. This is the next clear area where sellers may step in again if price recovers.
Bottom Line
The bullish case improves if GBP/NZD gets back above 2.3550 and stays there. This could open the door to a retest of 2.3650.
If price instead loses 2.3400, the bullish setup would be invalidated for now. Buyers would need to establish support again before another long entry makes sense.
Trade Idea: Bearish Scenario
Setup
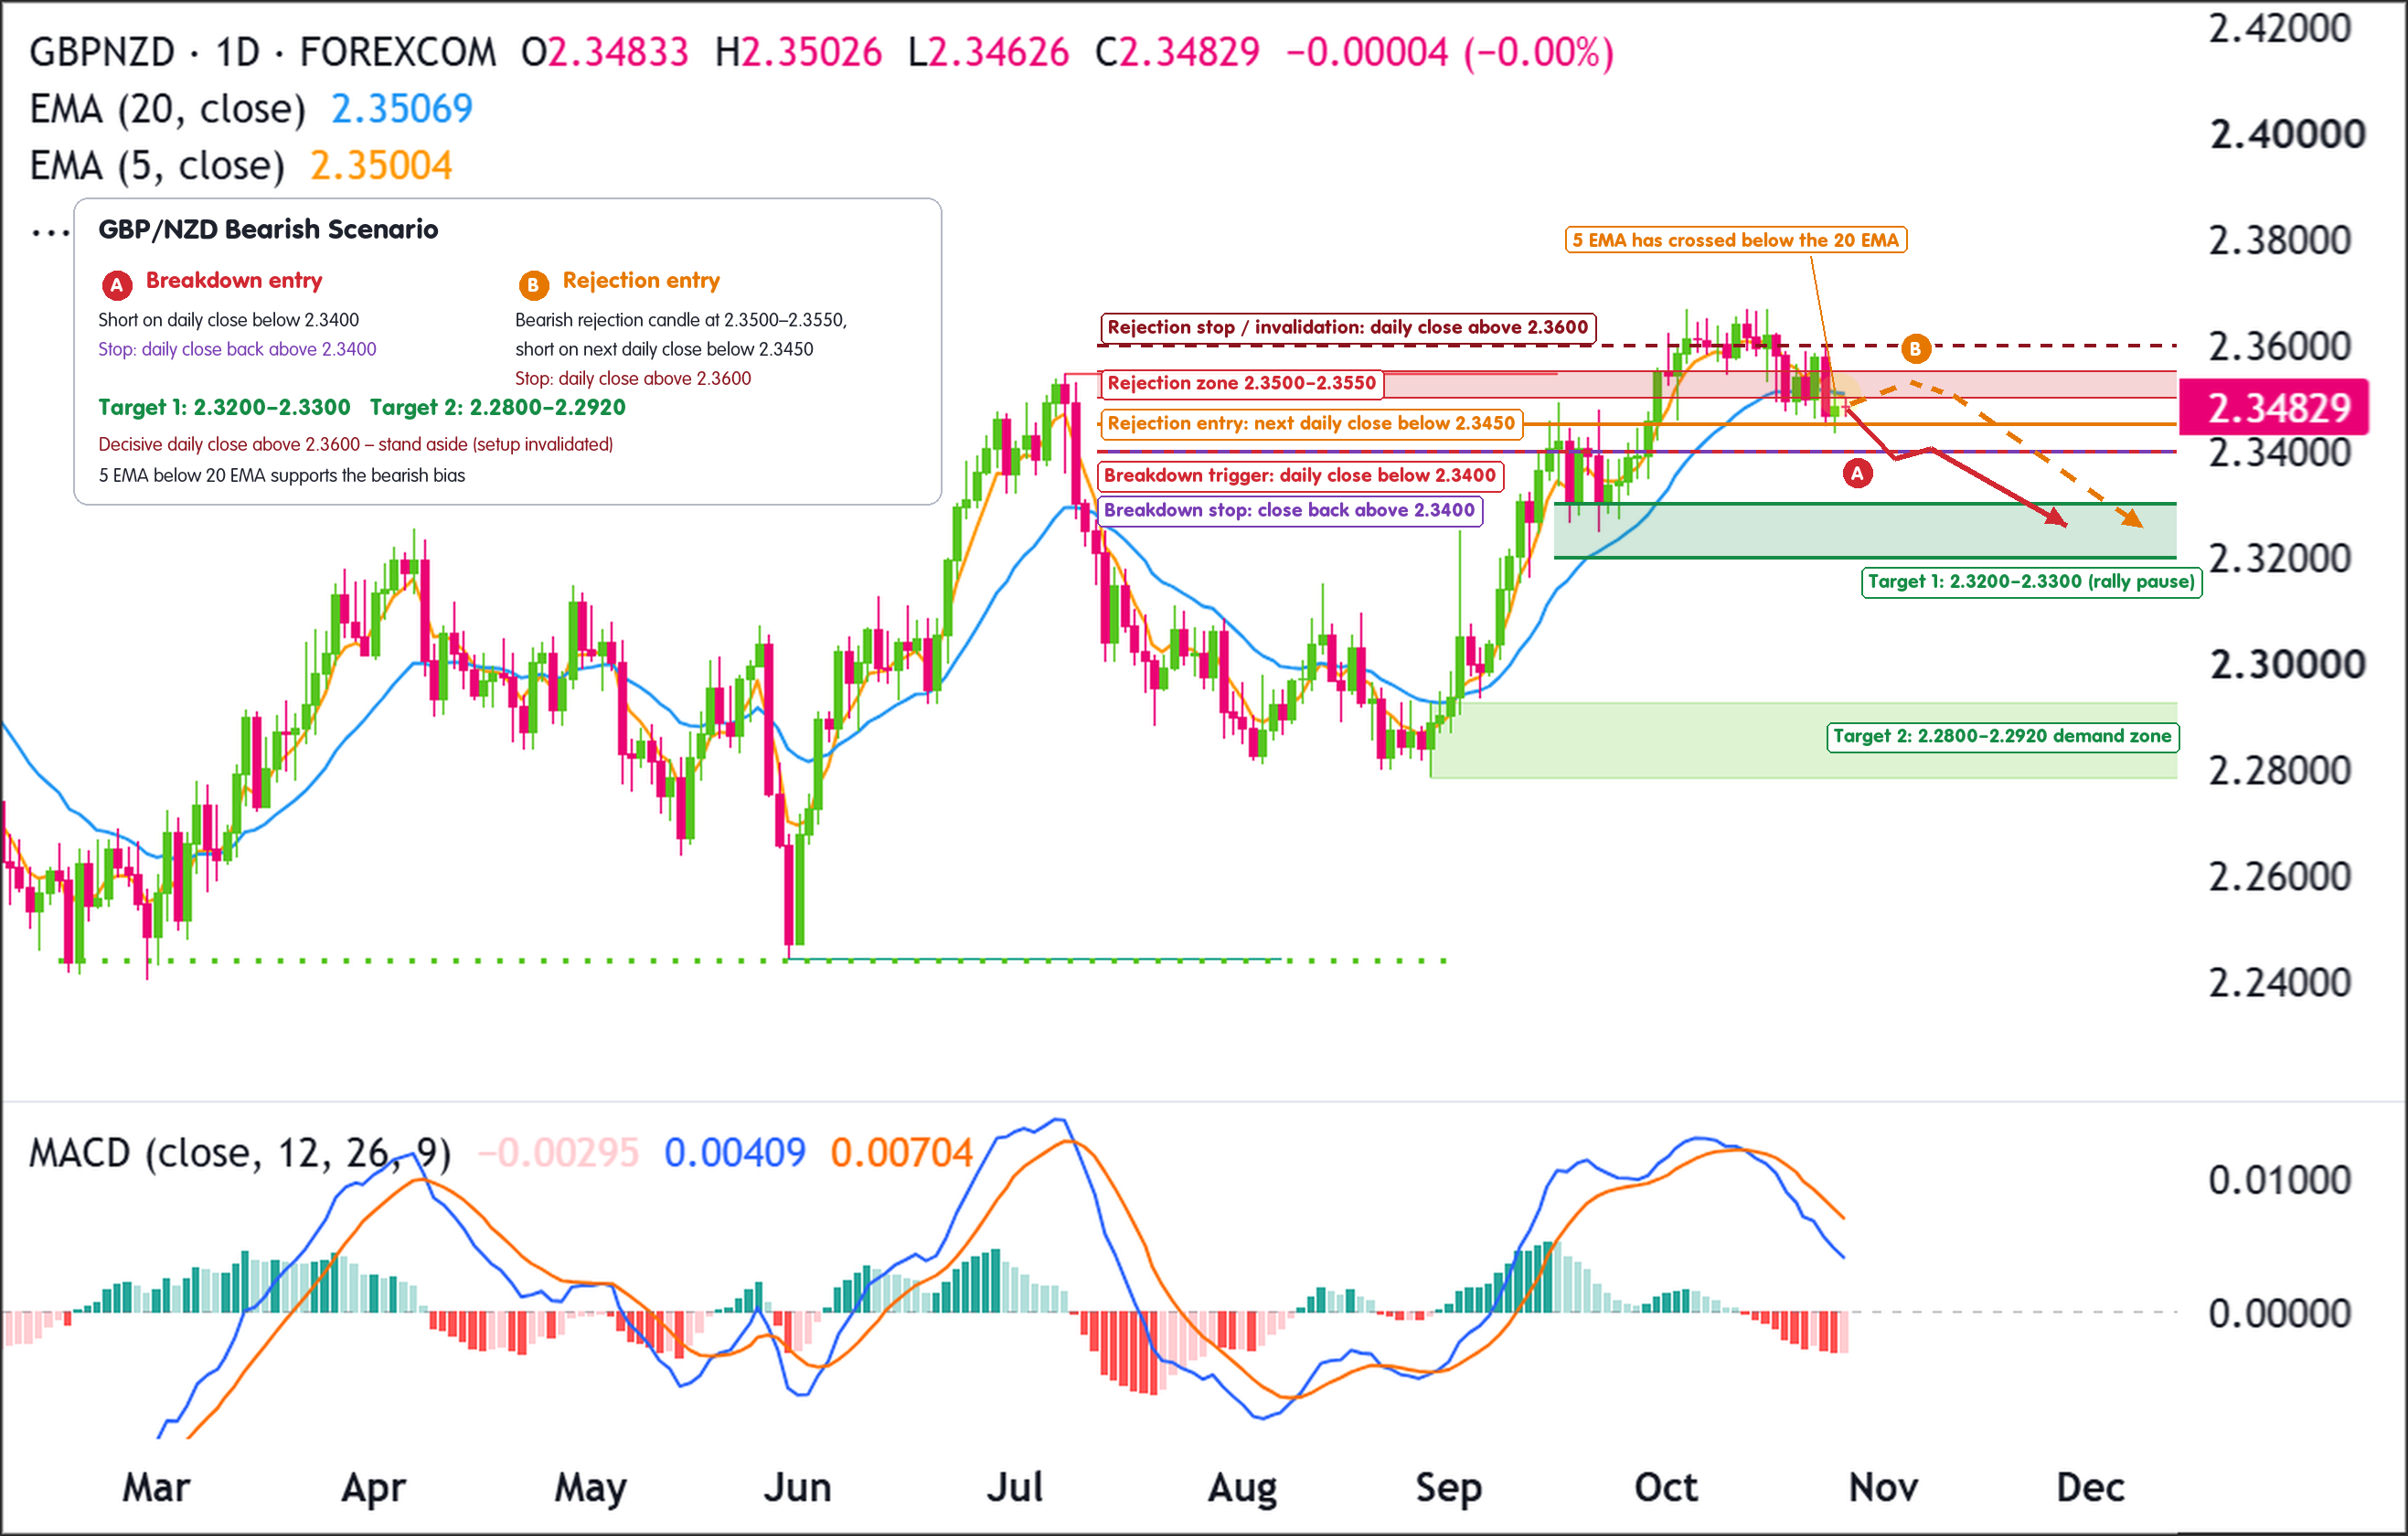
The bearish setup builds on the move back below the previous swing high at 2.3550 and the 5 EMA crossing below the 20 EMA. If GBP/NZD fails to get back above 2.3500-2.3550 and then breaks below 2.3400, sellers could push price toward lower support.
Entry
Consider entering short on a daily close below 2.3400, confirming that nearby support has failed.
Alternatively, if price rises into 2.3500-2.3550 and prints a clear bearish rejection candle, enter short on the next daily close below 2.3450.
If price instead closes decisively above 2.3600, stand aside. This would show buyers have pushed back through resistance and would invalidate the bearish setup.
Stop Loss
For breakdown entries, place the stop on a daily close back above 2.3400. This would show that price has reclaimed the support level it just broke.
For rejection entries near resistance, place the stop on a daily close above 2.3600. This would show buyers have pushed through the area where sellers were expected to step in.
Take Profit
Target 2.3200-2.3300 first, where price previously paused during the rally.
If selling continues, the green demand zone at 2.2800-2.2920 is a deeper area where buyers may try to step back in.
Bottom Line
The bearish case stays in focus while GBP/NZD remains below 2.3500-2.3550. A daily close below 2.3400 would strengthen the case for a move toward 2.3200-2.3300, with 2.2800-2.2920 as a possible deeper target.
A daily close above 2.3600 would invalidate the bearish setup by showing buyers have pushed back through resistance.
This content is strictly for informational purposes only and does not constitute as investment advice. Trading any financial market involves risk. Please read our Risk Disclosure to make sure you understand the risks involved.
Related Articles
- General News
Russell 2000 Stays Pegged by Trend Resistance and 200-Day MA
- Crypto News
Ethereum Price Analysis: Is $2K in Play as Bearish Sentiment Builds?
- Forex News
Chart Art: EUR/NZD Approaching Long-Term Triangle Bottom as RBNZ Looms
- Forex News
Speculator Extremes: FedFunds, Sugar, Australian Dollar & Natural Gas lead Bullish & Bearish Positions
- Stock Markets News
investingLive Asia-Pacific market news: Brazil ETF slumps on Lula win