Chart Art: EUR/NZD Approaching Long-Term Triangle Bottom as RBNZ Looms


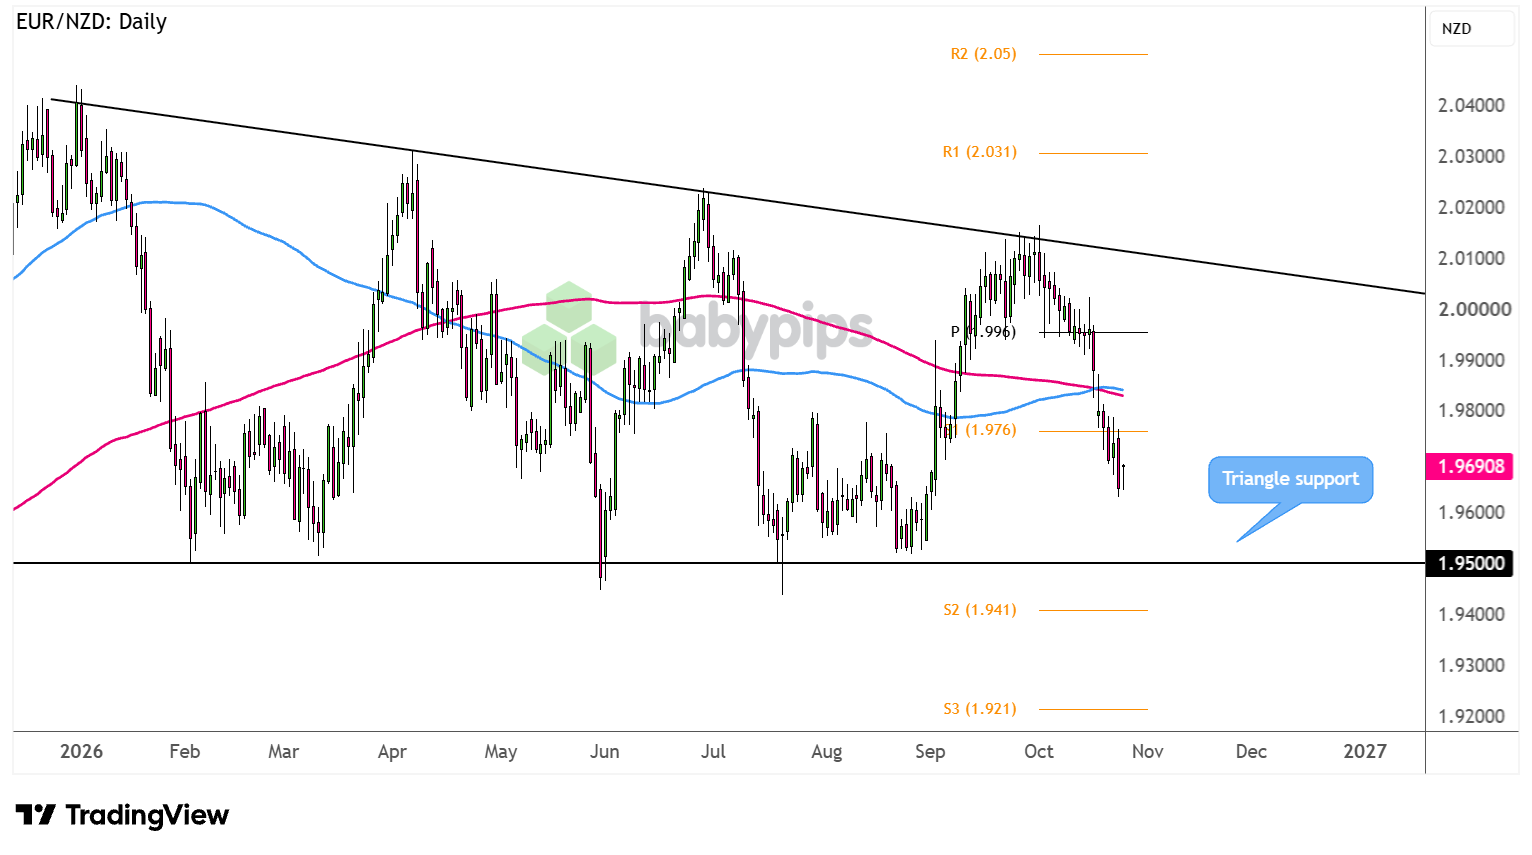
EUR/NZD is making its way close to the long-term descending triangle bottom while markets brace for the Reserve Bank of New Zealand’s (RBNZ) rate decision.
EUR/NZD bounced off the long-term descending triangle resistance we spotted a few weeks back.
Now the pair is making its way close to the triangle bottom while markets brace for the Reserve Bank of New Zealand’s (RBNZ) rate decision.
Will support still hold?
EUR/NZD: Daily
French debt concerns and a widening OAT-Bund spread have been weighing on the euro for a good chunk of October, while cost-of-living riots in France have added headwinds.
It didn’t help that the French government failed to pass a budget last week, contributing to political uncertainty ahead of the elections.
Meanwhile, expectations of an RBNZ interest rate are strongly in play, though a “dovish hike” could still drag the Kiwi south.
EUR/NZD gapped down last week and has closed below both moving averages to suggest that bearish momentum is picking up.The pair has also tumbled below S1 (1.9760) and appears to be setting its sights on the descending triangle support at the 1.9500 major psychological mark.
Keep your eyes peeled for reversal candlesticks at this long-term floor pointing to a potential bounce back to upside targets, including S1 and the pivot point (1.9960) close to the triangle top.
On the other hand, long red candles closing below the triangle bottom could confirm a break lower and put EUR/NZD on track towards testing the next support zones at S2 (1.9410) then S3 (1.9210).
Whichever bias you end up trading, don’t forget to practice proper risk management and stay aware of top-tier catalysts that could influence overall market sentiment!
Related Articles
- Stock Markets News
investingLive European session wrap: Equities cautious as Treasury yields rebound, oil holds firm
- Forex News
The French Debt Crisis Adds to Pressure on the Euro
- Forex News
NASDAQ faces heavy selling pressure. Investors turn to Switzerland as a safe haven
- Stock Markets News
European shares close lower as French fiscal turmoil drives weekly loss
- Forex News
Fundies Cheat Sheet, Oct 26–30, 2026