Oh Dear, Condo Prices Dropped by 15% to 34% in 40 Bigger Markets Already, and by 8% to 14% in another 28 Markets

In 6 markets, prices have plunged back to where they’d been 20 years ago.
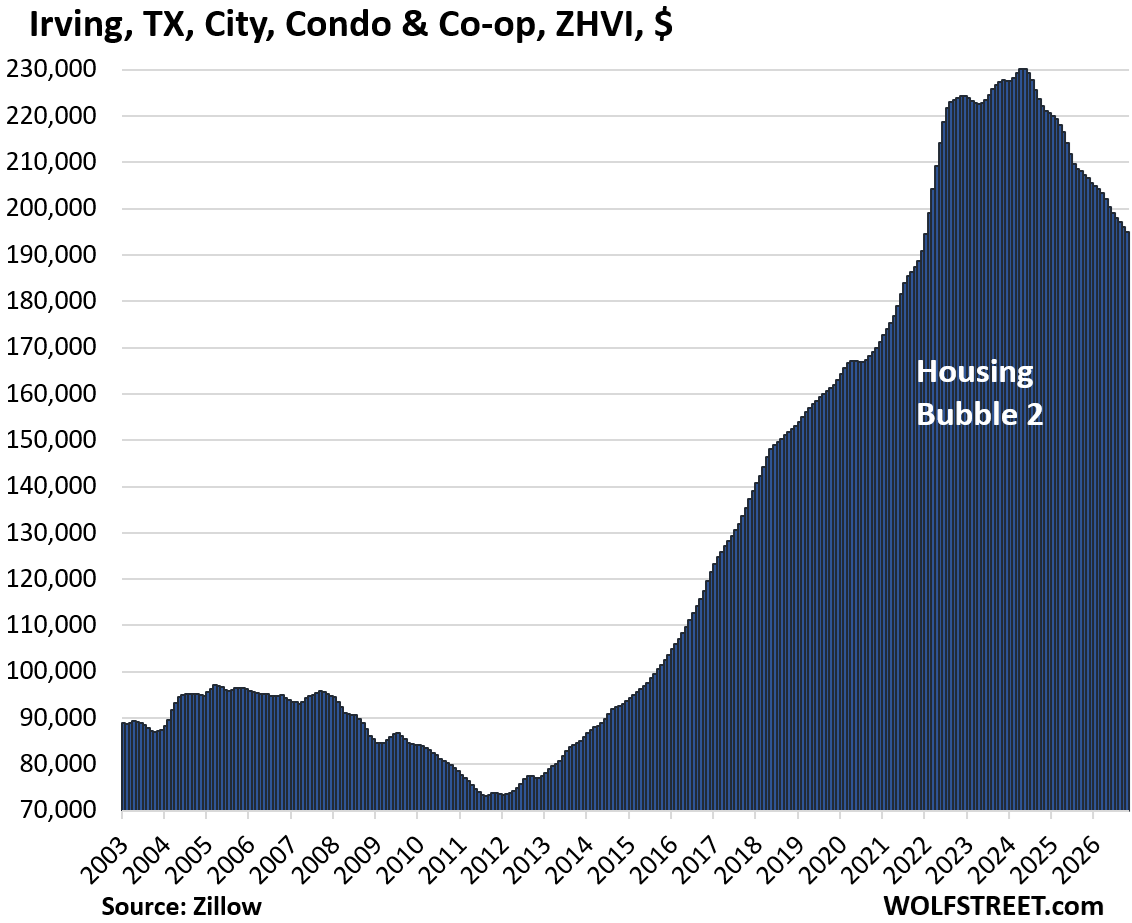
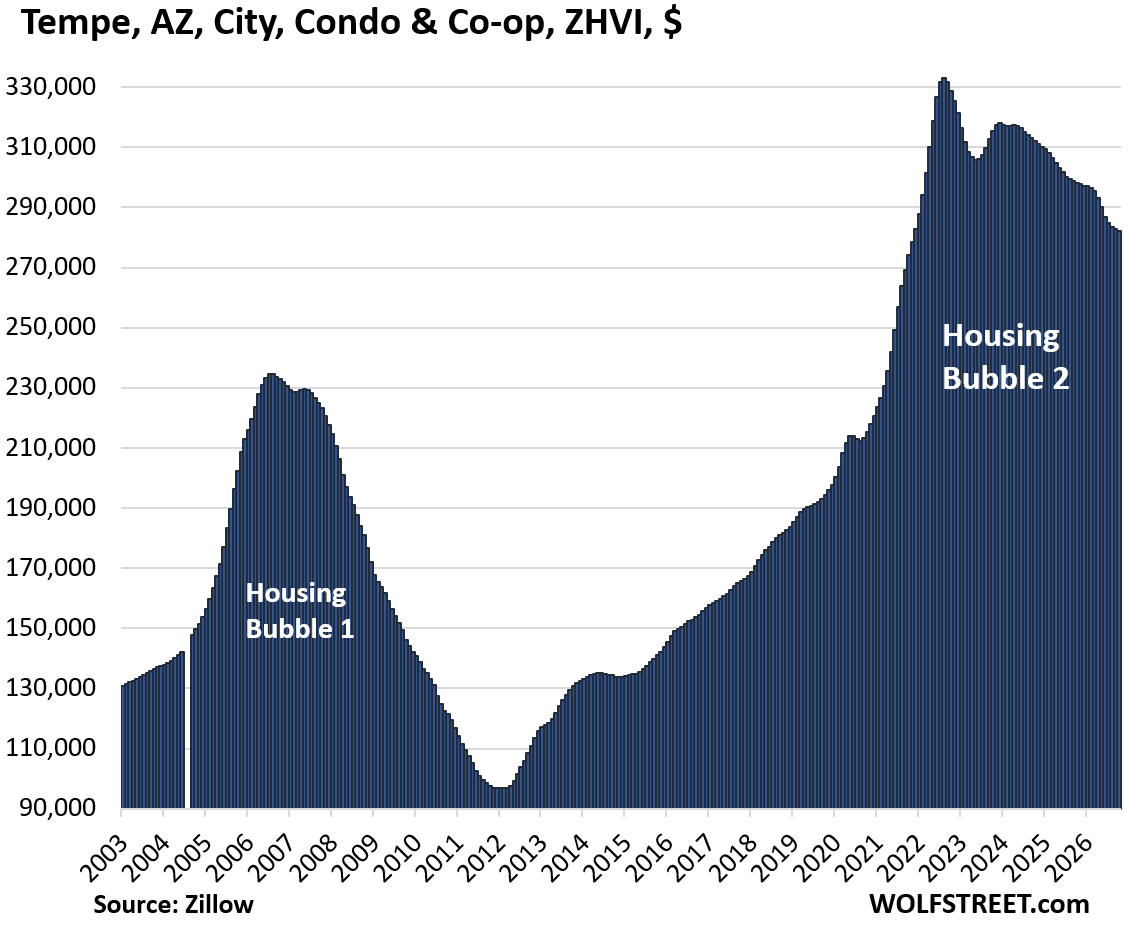
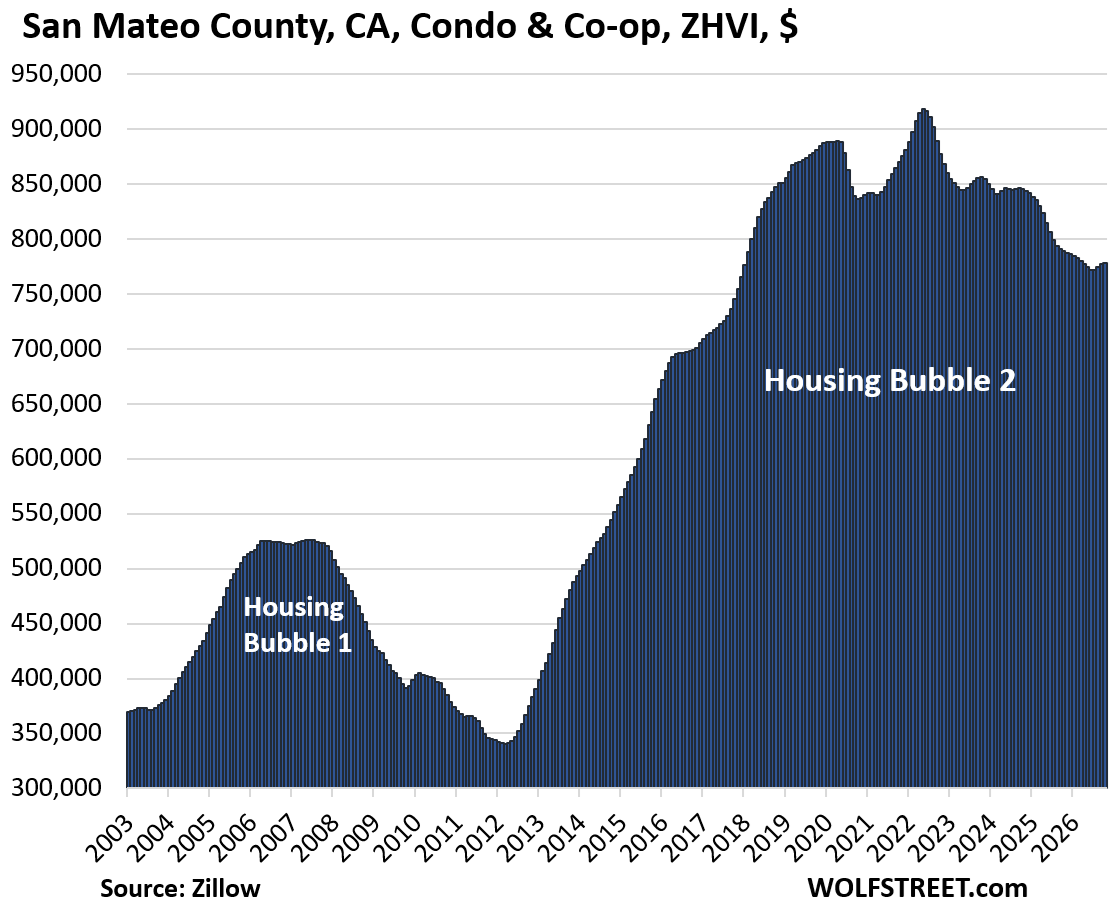
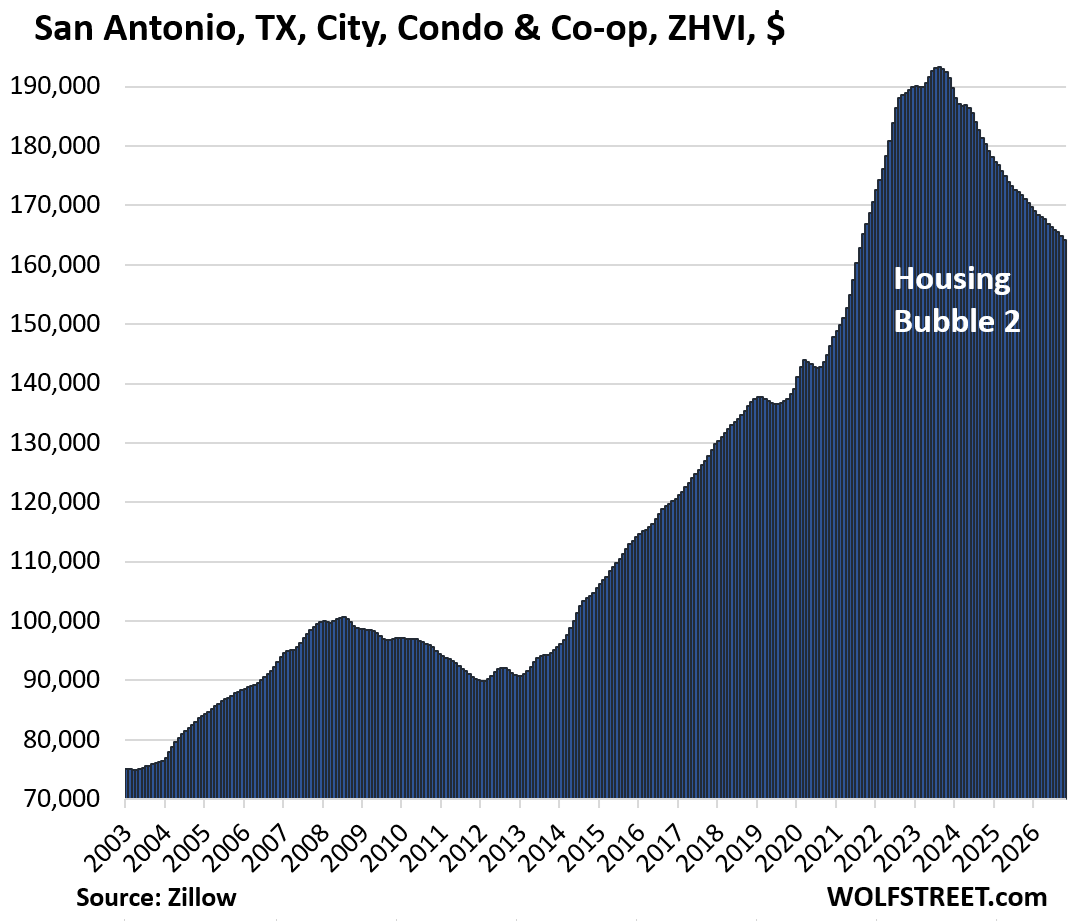
Prices of mid-tier condos through October have dropped by 15% to 34% from their respective peaks in 40 bigger markets, depicted in the charts below.
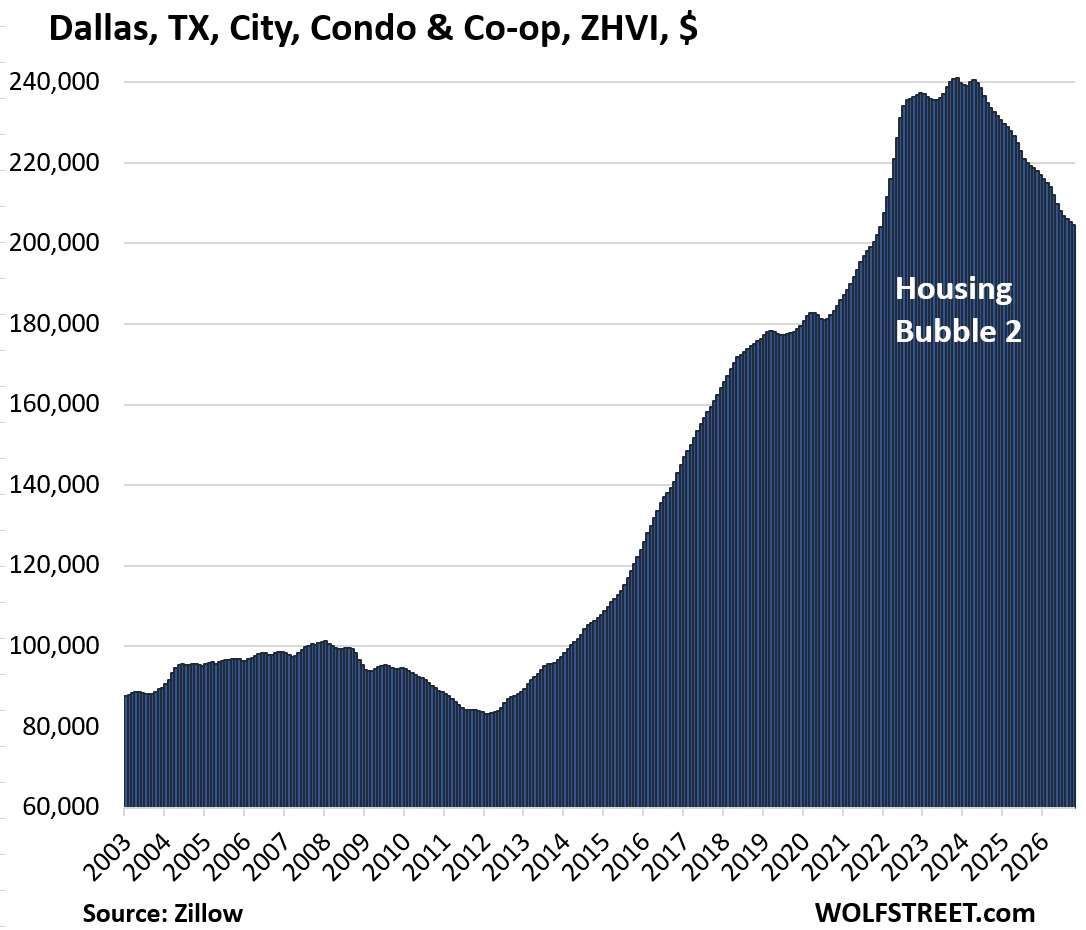
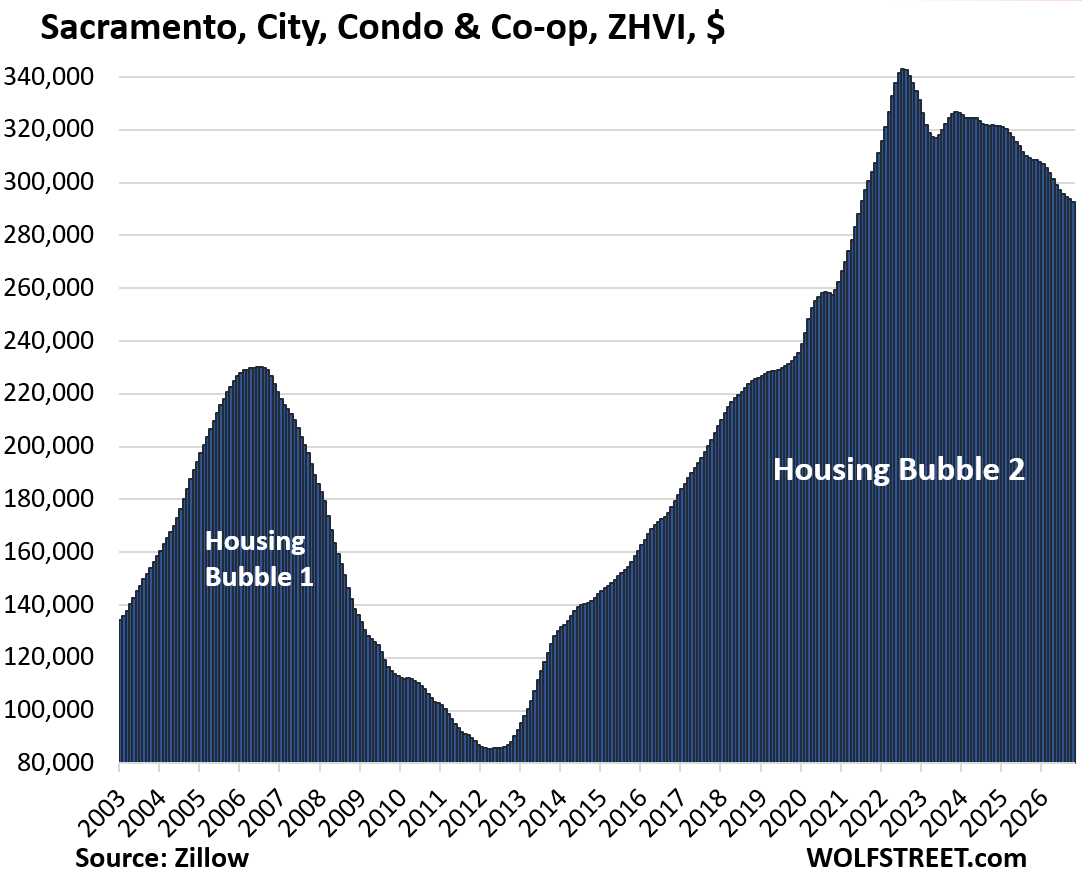
Six more cities on the list: In six more cities, prices fell enough to move them onto this list, from the fell-14%-or-less list, in the two months since I last posted this update. In October, those six cities were down by 15% or more from their respective peaks, including Sacramento, CA; Dallas, TX; San Antonio, TX; and Huntsville, AL.
The majority of the peaks occurred in mid-2022, the rest in 2023 and 2024, ending the price explosions that had occurred from mid-2020 to mid-2022, on top of the steep price increases in prior years.
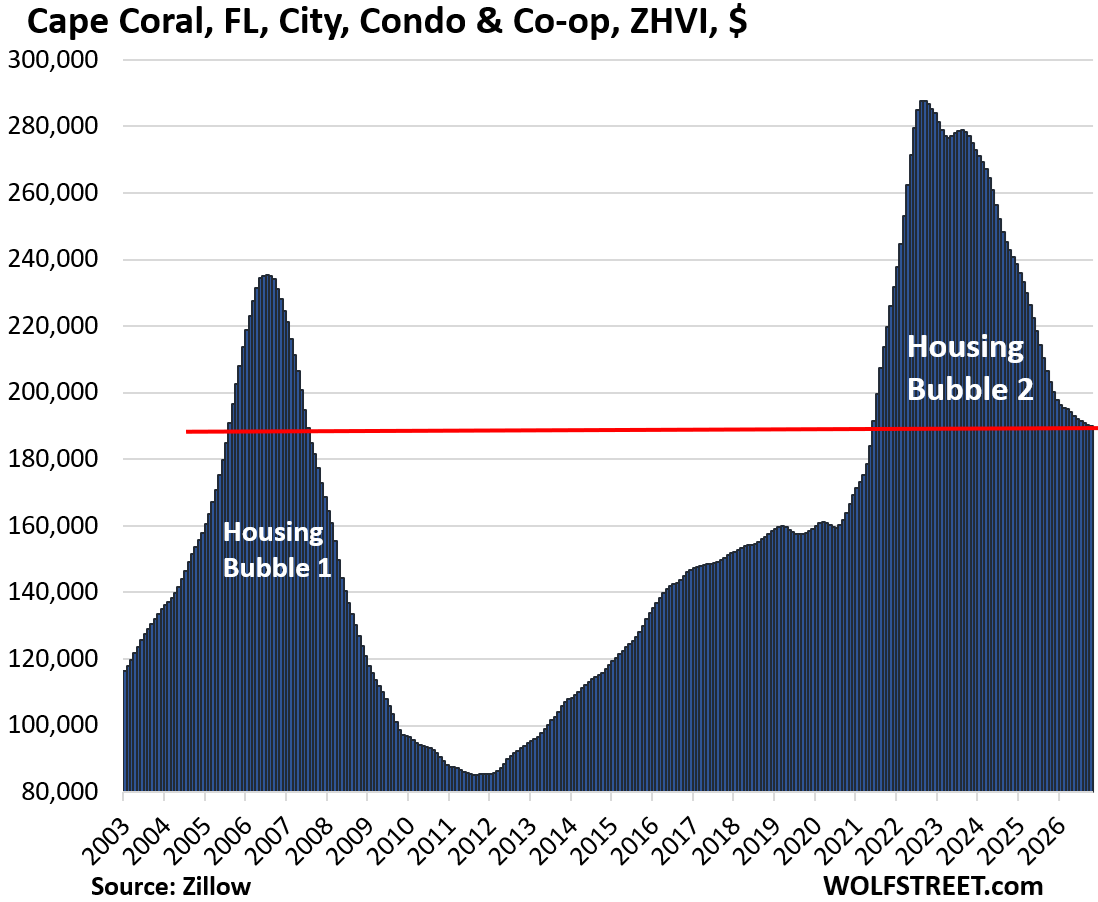
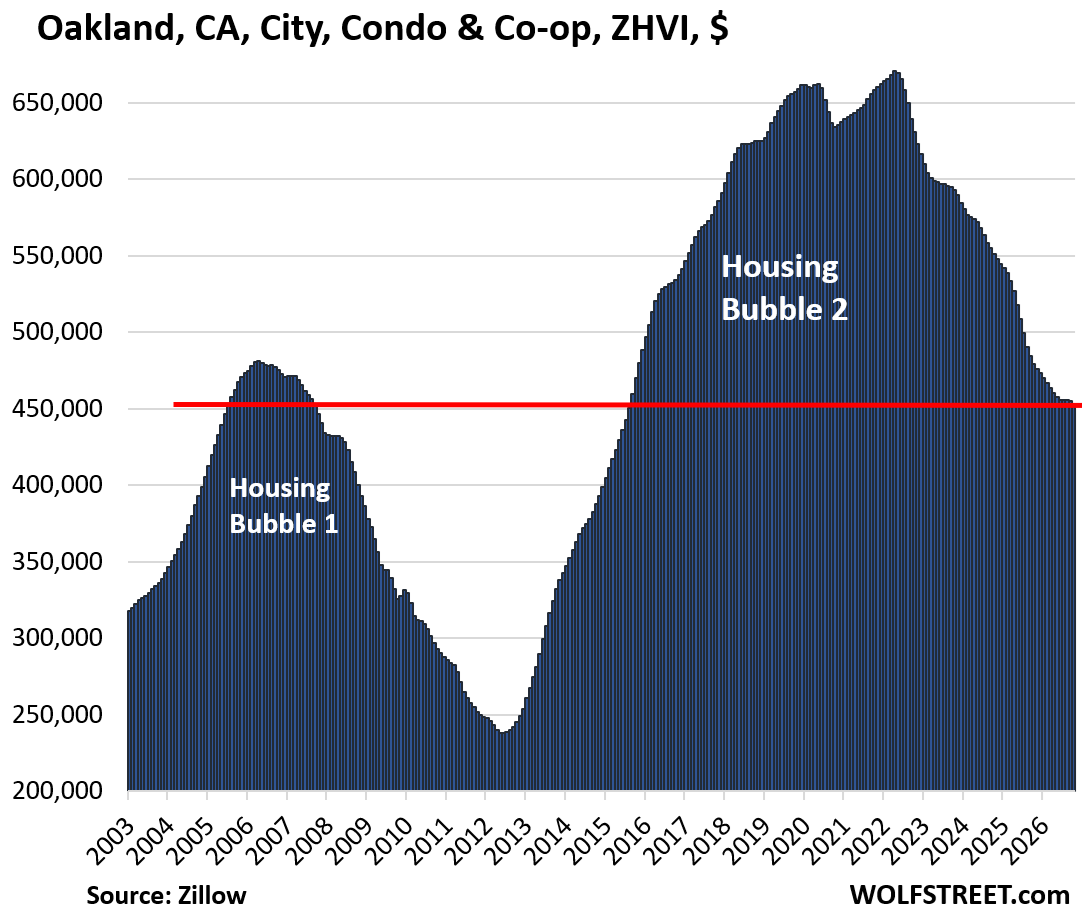
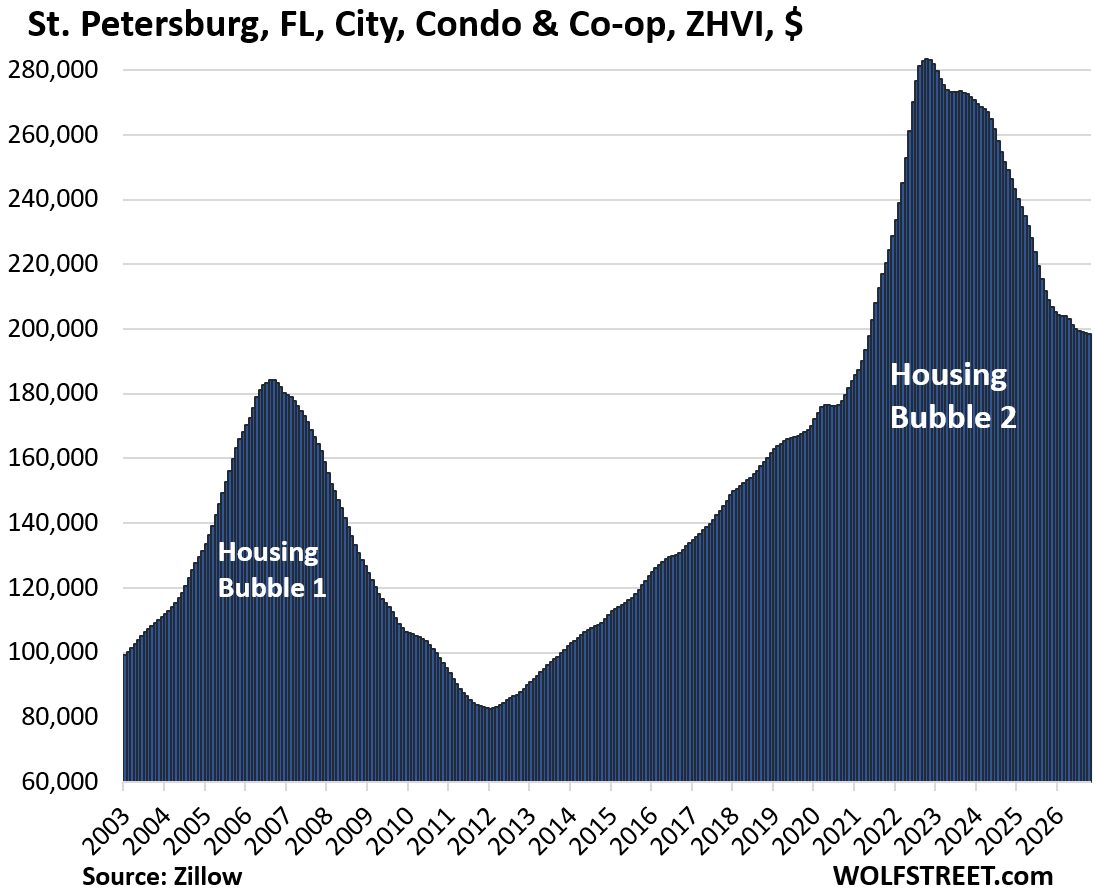
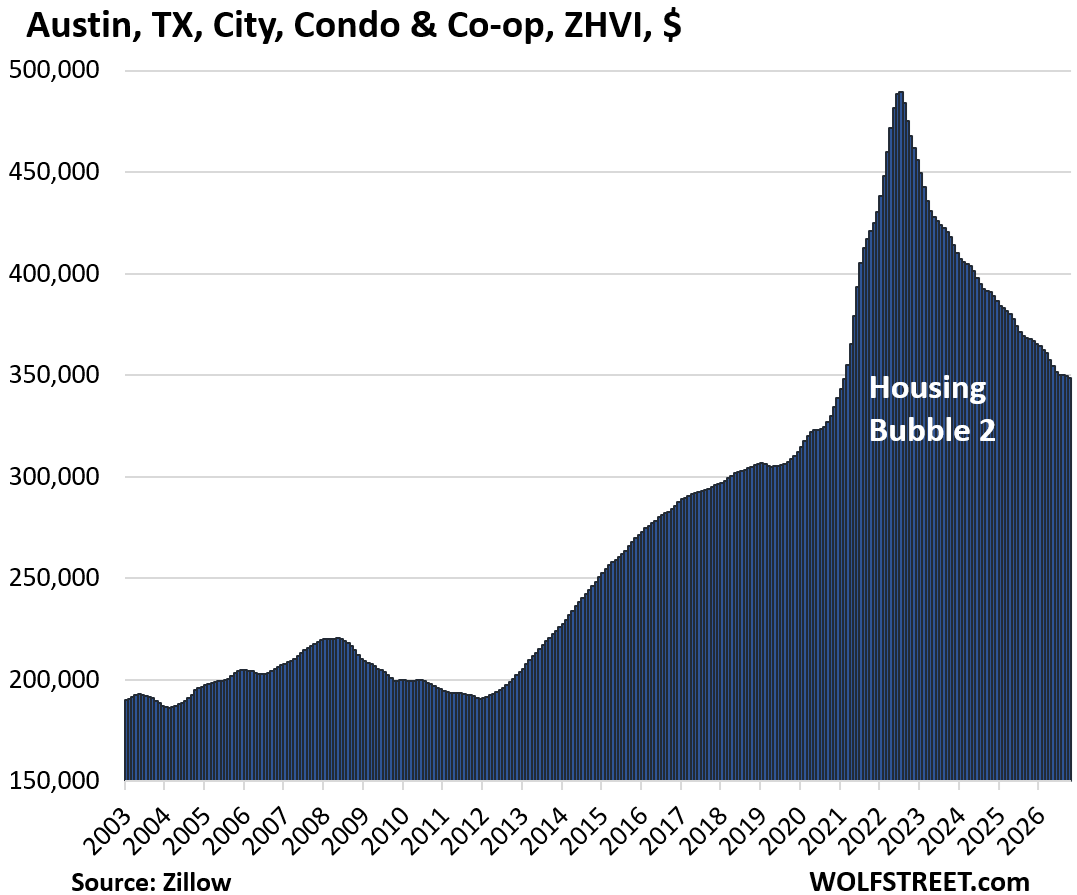
Prices of mid-tier condos dropped by 20% or more in 12 of these 40 markets, including 3 markets with 30%-plus drops (Cape Coral, FL; Oakland, CA; St. Petersburg, FL). In Austin, TX, prices dropped by 29% line. These are significant price drops.
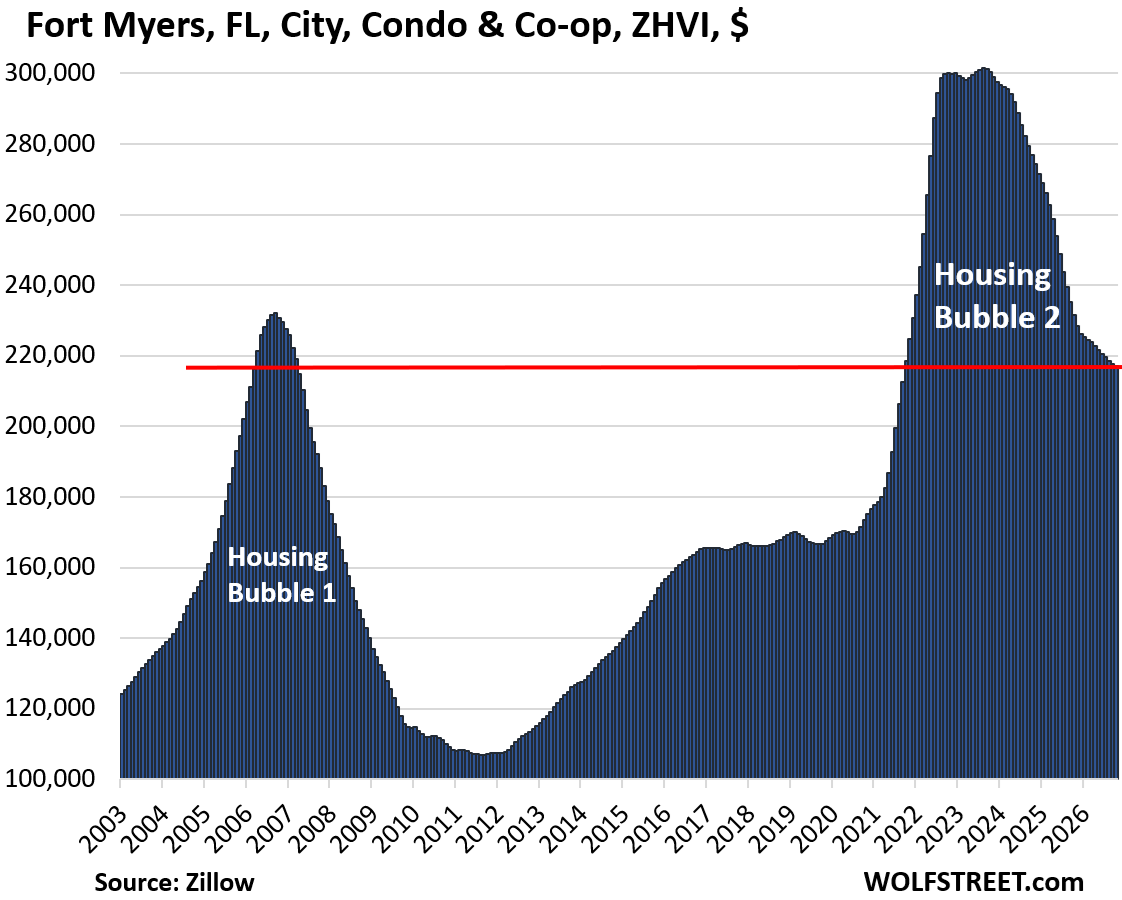
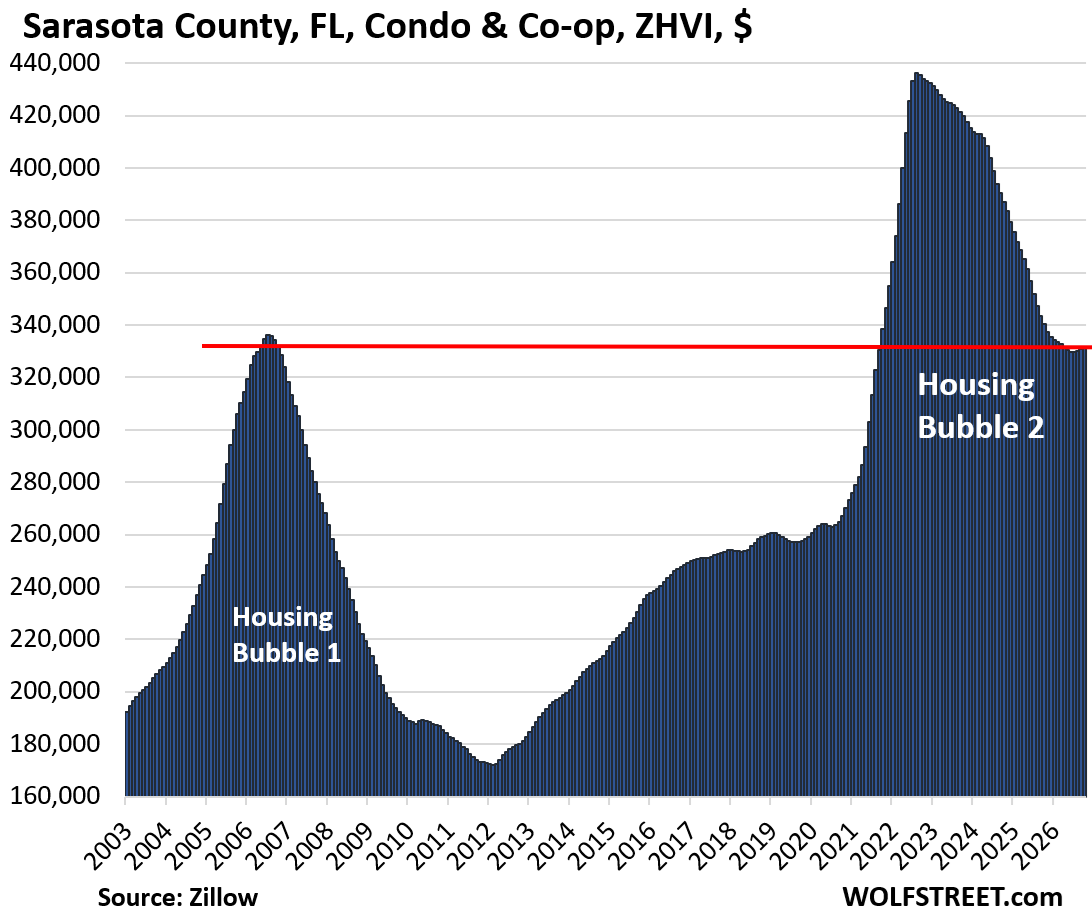
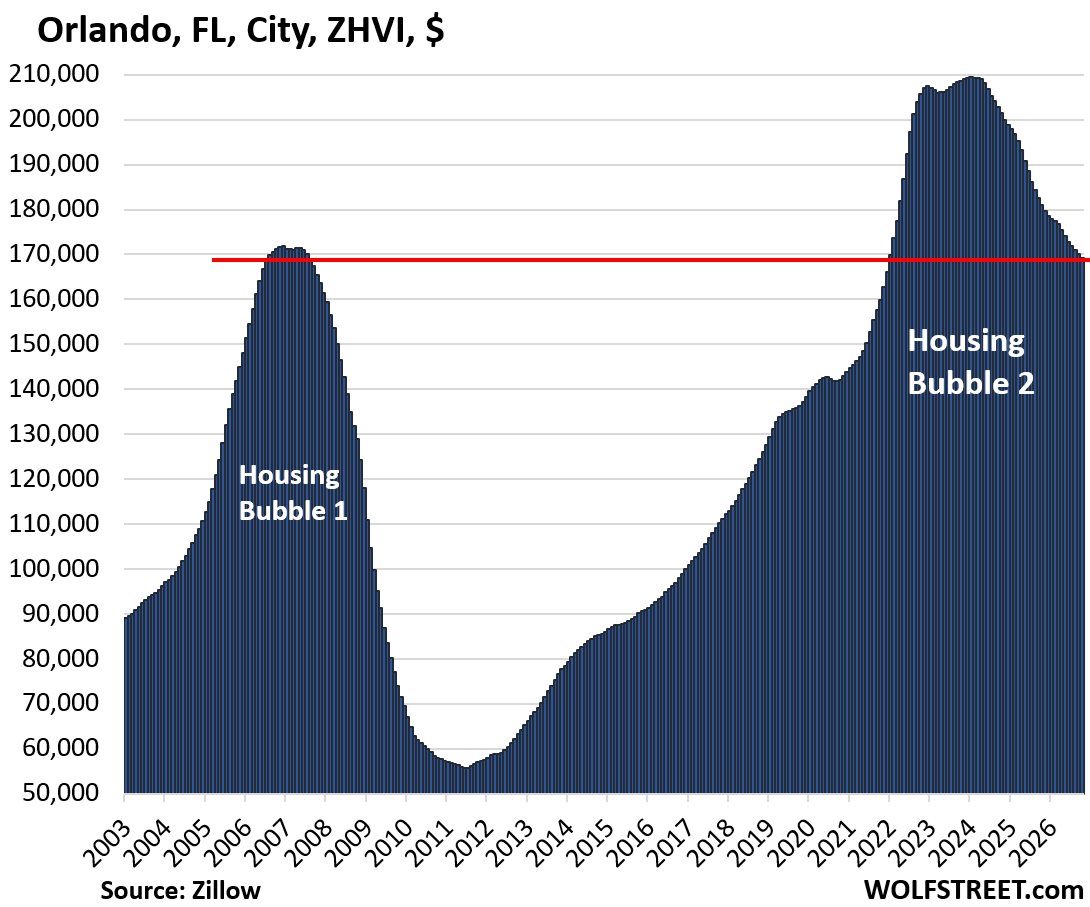
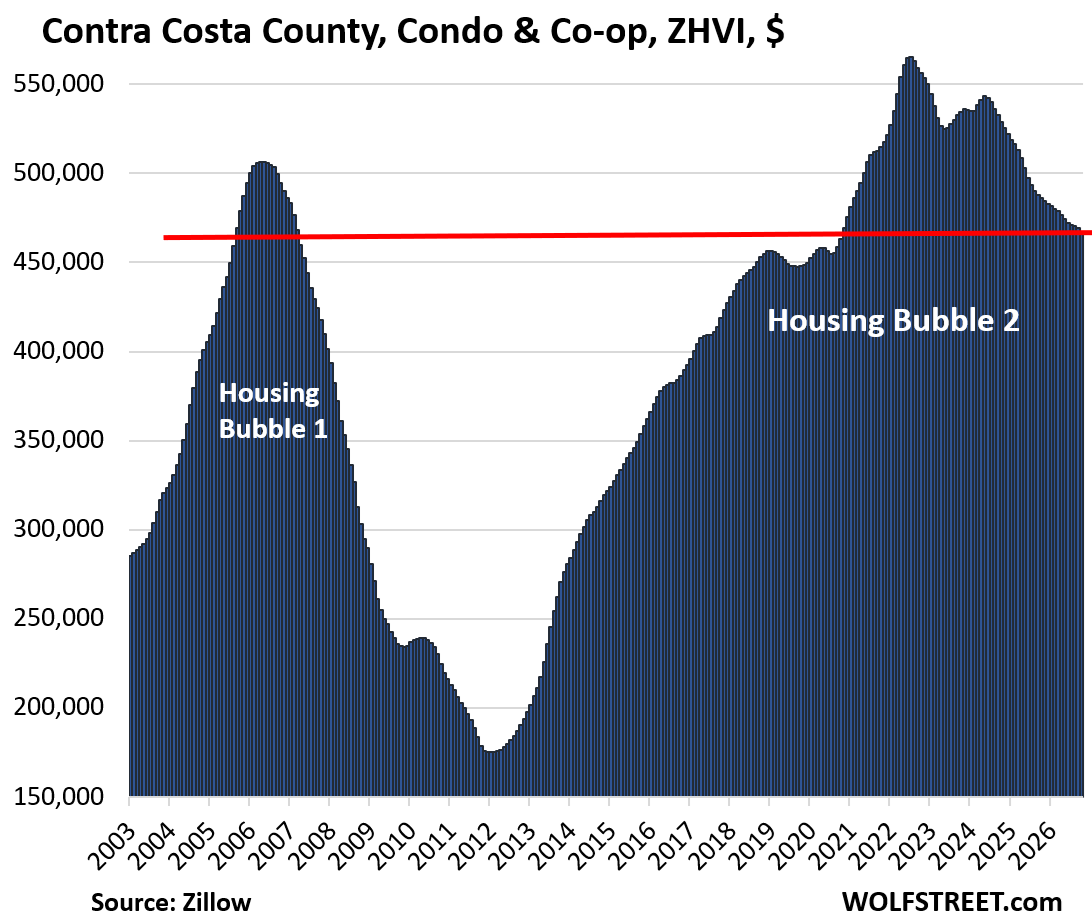
Dropped below 2006 levels: In 6 of these 34 markets, condo prices have plunged below their highs during Housing Bubble 1 in 2006. Prices in those markets are now back where they’d been 20 years ago.
- Cape Coral, FL;
- Oakland, CA;
- Fort Myers, FL;
- Sarasota County, FL;
- Orlando, FL;
- Contra Costa County (San Francisco Bay Area), CA.
Condos can be a great home for hassle-free, worry-free, convenient living in an urban center with lots of amenities (such as pool, gym, staffed front desk that takes packages and announces visitors, etc.). Condos in towers tend to come with spectacular views. Condos in high-end towers in expensive cities can carry price tags of many millions of dollars.
Condos come in all sizes, from studios to palaces spread across entire floors or multiple floors of condo towers. Citadel founder Ken Griffin paid $238 million in 2019 for the multi-floor penthouse condo at 220 Central Park South, a tower on Billionaire’s Row in Manhattan, the most expensive home purchase in the US at the time. When it comes to condos, there’s something for everyone.
But… condos are subject to dynamics that can lead to massive bubbles and busts, and now there are additional issues, including a Fannie Mae condo blacklist that can hammer prices (see discussion below the charts: “A reminder of the special issues condos face”).
Condo prices exploded in two years from mid-2020 to mid-2022 by 50%, 60%, or even 70% in some of the markets, on top of the already steep price increases in prior years. In the 10 years to their respective peaks, prices had soared by 180% to 350% in these markets. And many of those bubbles are now painfully deflating.
Most of the markets here are “cities.” But several are counties whose numerous cities – though often household names – are too small to be included individually. The list includes one metropolitan statistical area for the same reasons. New York County is also included, which is Manhattan where condos are a big part of the market.
These 40 condo markets are depicted in 39 charts below (no chart for Huntsville, AL, because the ZHVI condo data for it doesn’t go back further than 2008).
| Mid-tier condo prices fell by 15% to 34% from peak | |||
| Condo Market | Since peak | Year of peak | |
| 1 | Cape Coral, FL | -34% | 2022 |
| 2 | Oakland, CA | -32% | 2022 |
| 3 | St. Petersburg, FL | -30% | 2022 |
| 4 | Austin, TX | -29% | 2022 |
| 5 | Fort Myers, FL | -28% | 2023 |
| 6 | Sarasota County, FL | -24% | 2022 |
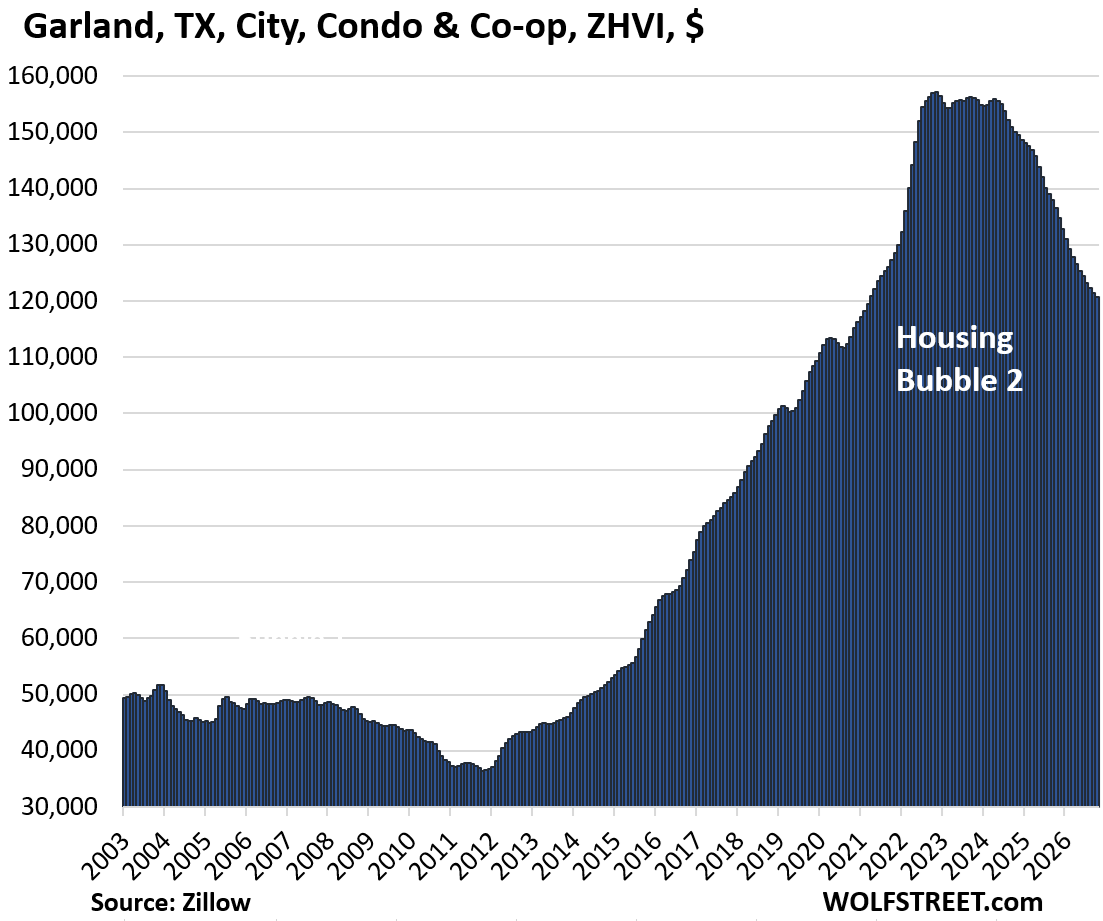
| 7 | Garland, TX | -23% | 2022 |
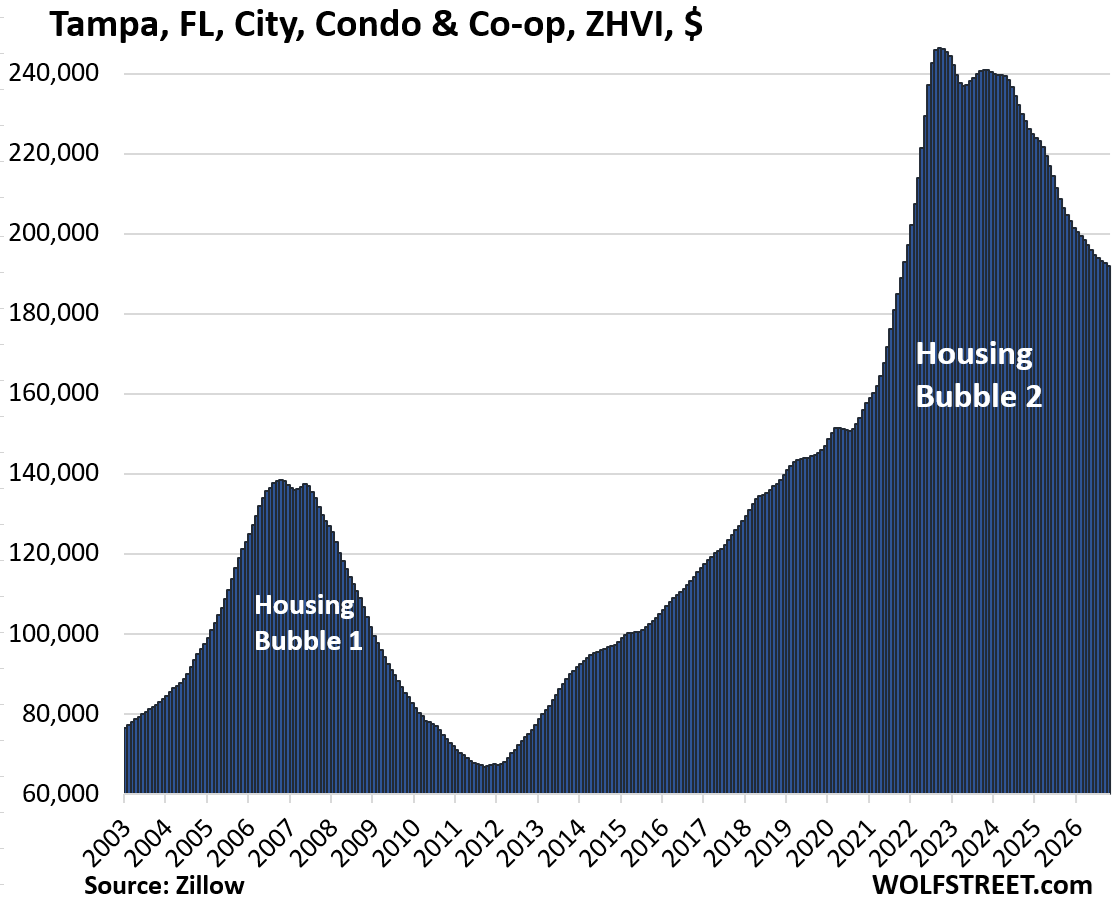
| 8 | Tampa, FL | -22% | 2022 |
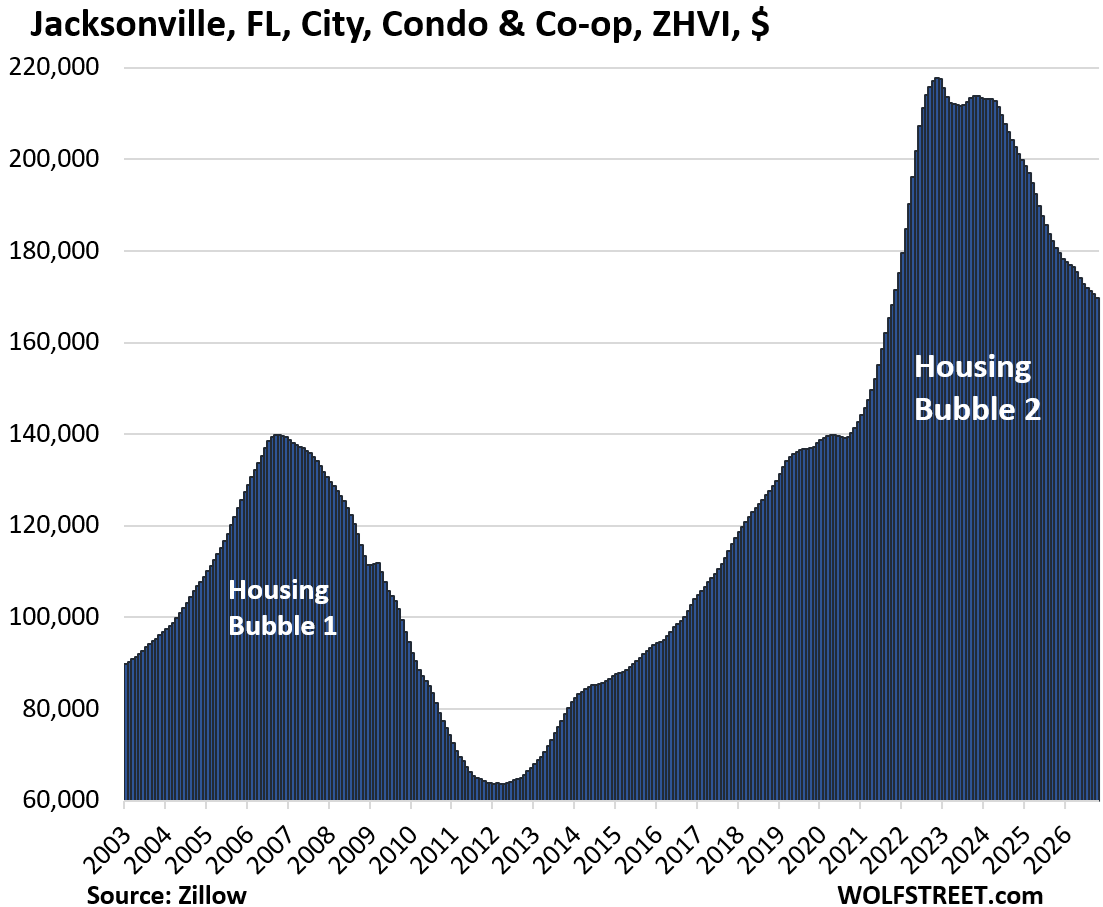
| 9 | Jacksonville, FL | -22% | 2022 |
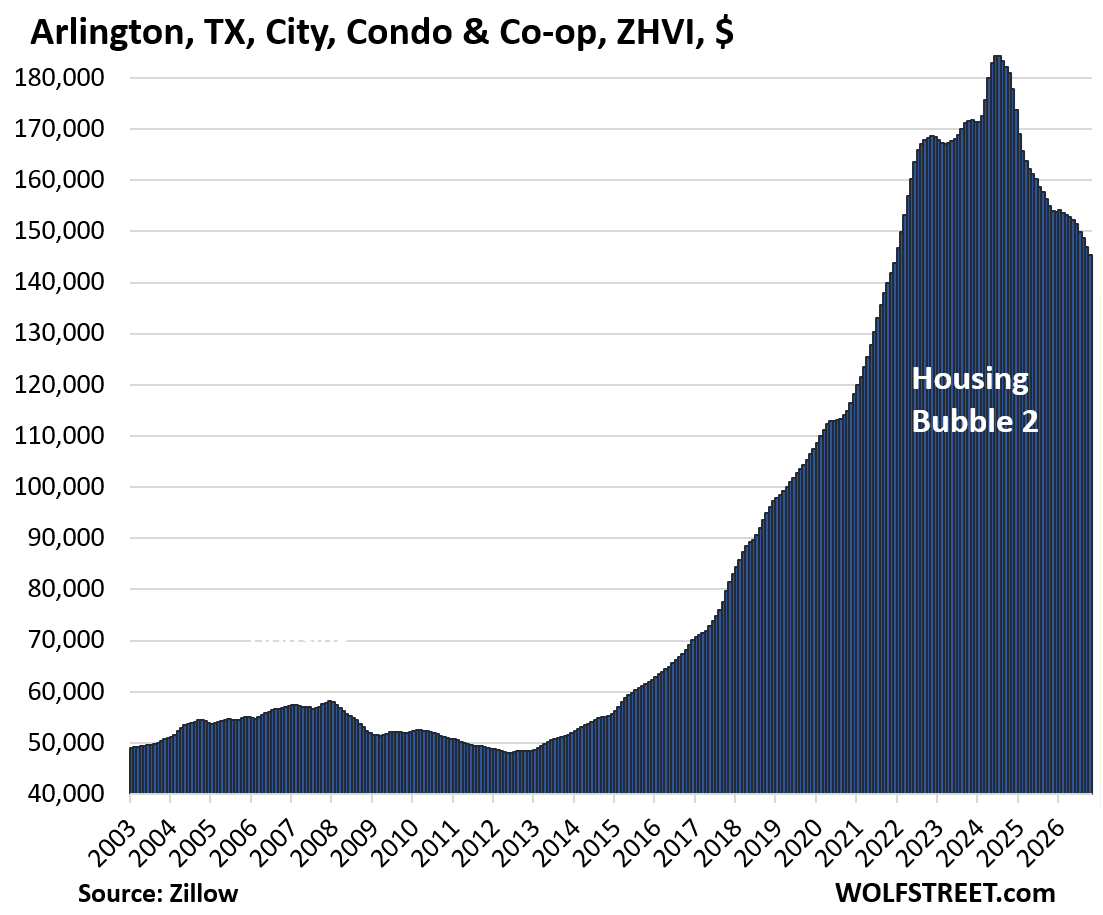
| 10 | Arlington, TX | -21% | 2024 |
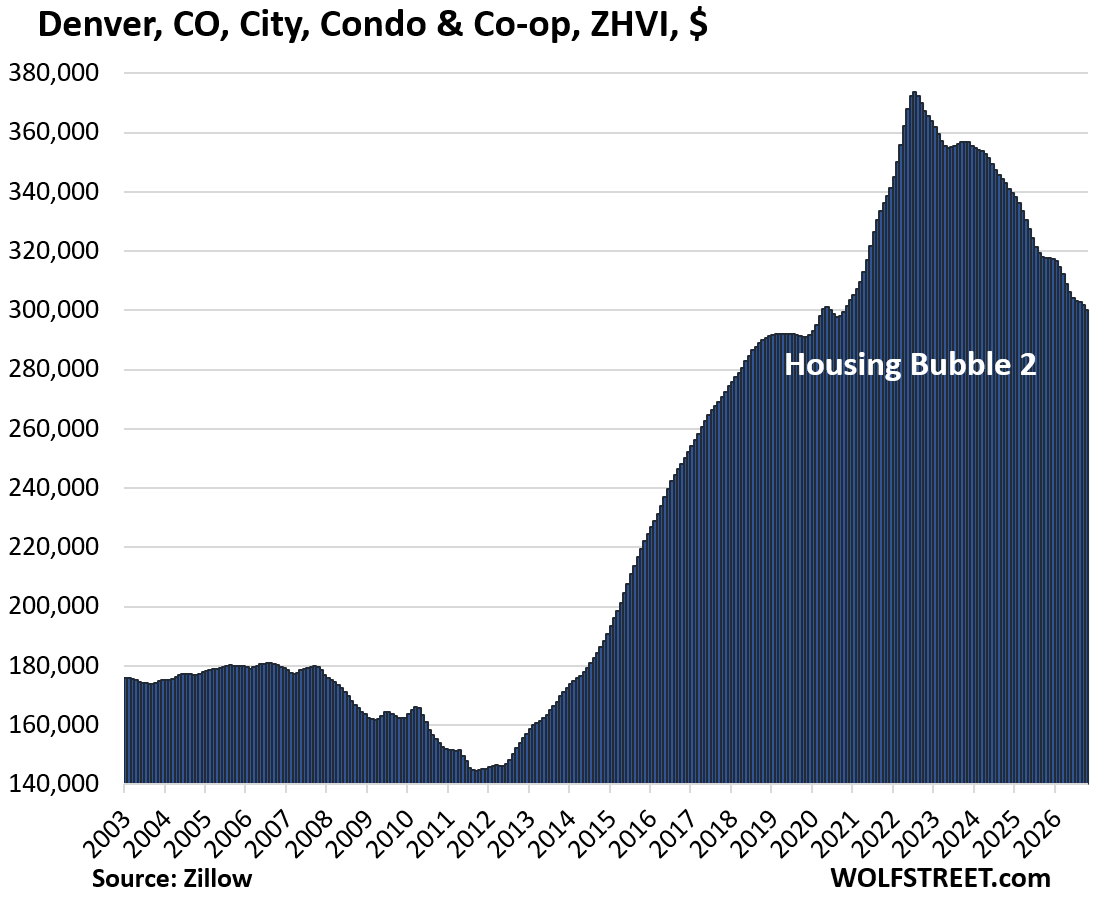
| 11 | Denver, CO | -20% | 2022 |
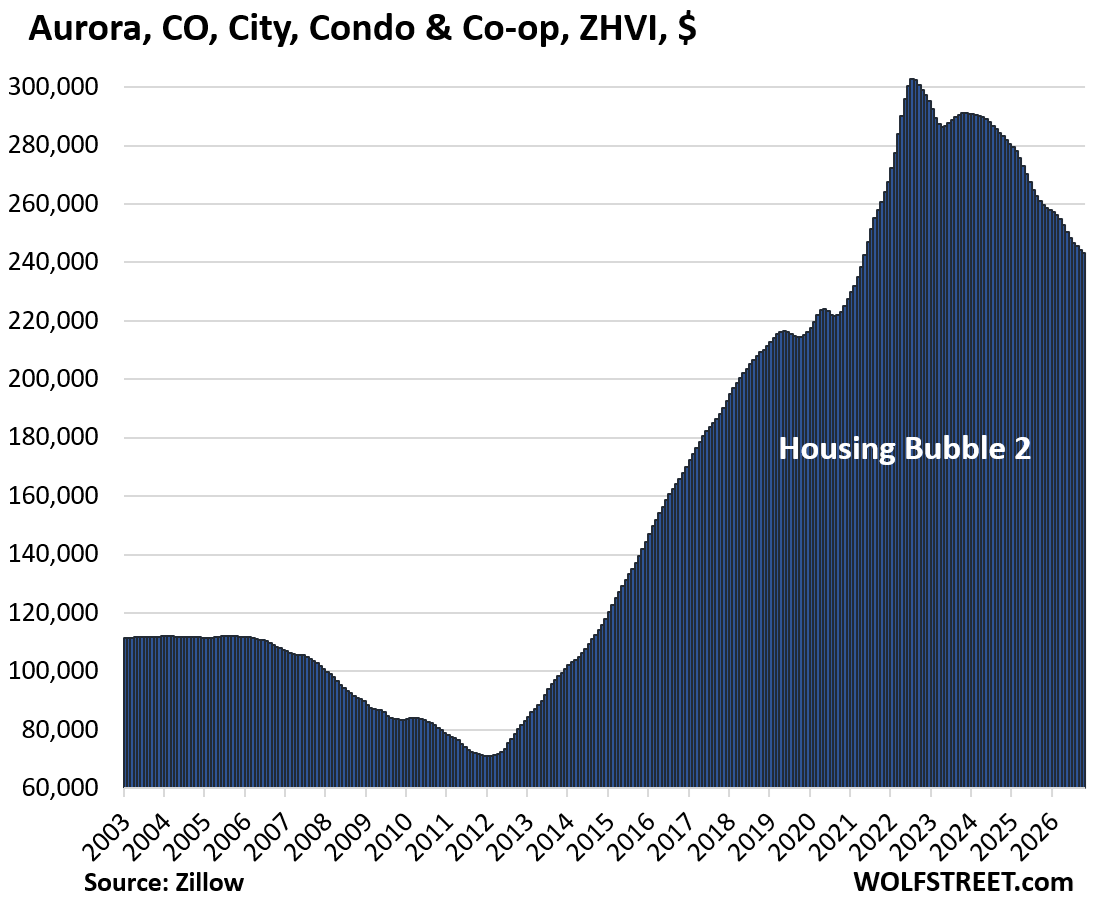
| 12 | Aurora, CO | -20% | 2022 |
| 13 | Orlando, FL | -19% | 2024 |
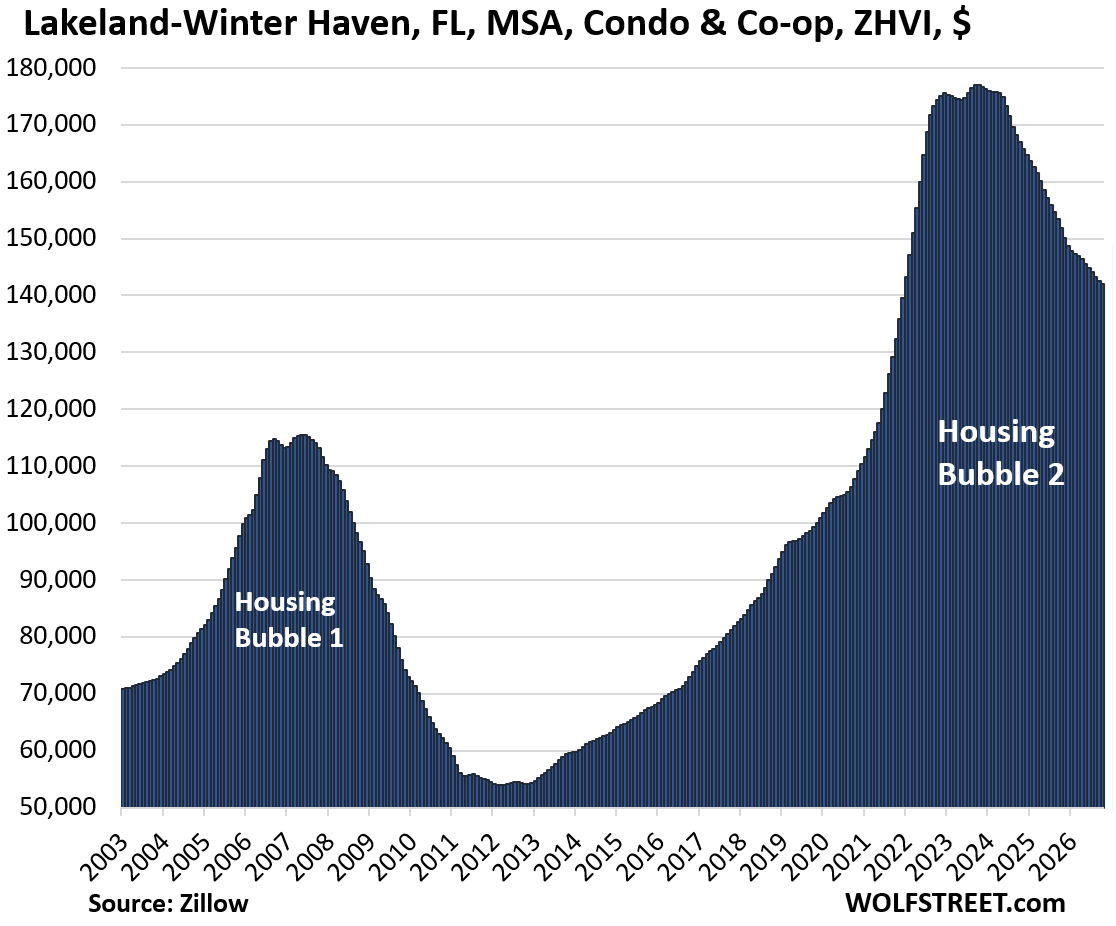
| 14 | Lakeland-Winter Haven, metro, FL | -19% | 2023 |
| 15 | Detroit, MI | -19% | 2021 |
| 16 | Seattle, WA | -19% | 2022 |
| 17 | Collier County (Naples), FL | -18% | 2022 |
| 18 | Raleigh, NC | -18% | 2022 |
| 19 | Plano, TX | -18% | 2022 |
| 20 | Hayward, CA | -18% | 2022 |
| 21 | Fort Lauderdale, FL | -18% | 2024 |
| 22 | Contra Costa County, CA, Bay Area’s 2nd largest county | -17% | 2022 |
| 23 | Port Saint Lucie, FL | -17% | 2024 |
| 24 | Mesa, AZ | -17% | 2022 |
| 25 | Manhattan, NY (New York County) | -17% | 2022 |
| 26 | Fremont, CA | -17% | 2022 |
| 27 | Portland, OR | -16% | 2022 |
| 28 | Chandler, AZ | -16% | 2022 |
| 29 | Houston, TX | -16% | 2024 |
| 30 | Glendale, AZ | -16% | 2022 |
| 31 | Phoenix, AZ | -15% | 2022 |
| 32 | Irving, TX | -15% | 2023 |
| 33 | Tempe, AZ | -15% | 2022 |
| 34 | San Mateo County (northern Silicon Valley), CA | -15% | 2022 |
| 35 | Huntsville, AL | -15% | 2022 |
| 36 | San Antonio, TX | -15% | 2024 |
| 37 | Dallas, TX | -15% | 2023 |
| 38 | Sacramento, CA | -15% | 2022 |
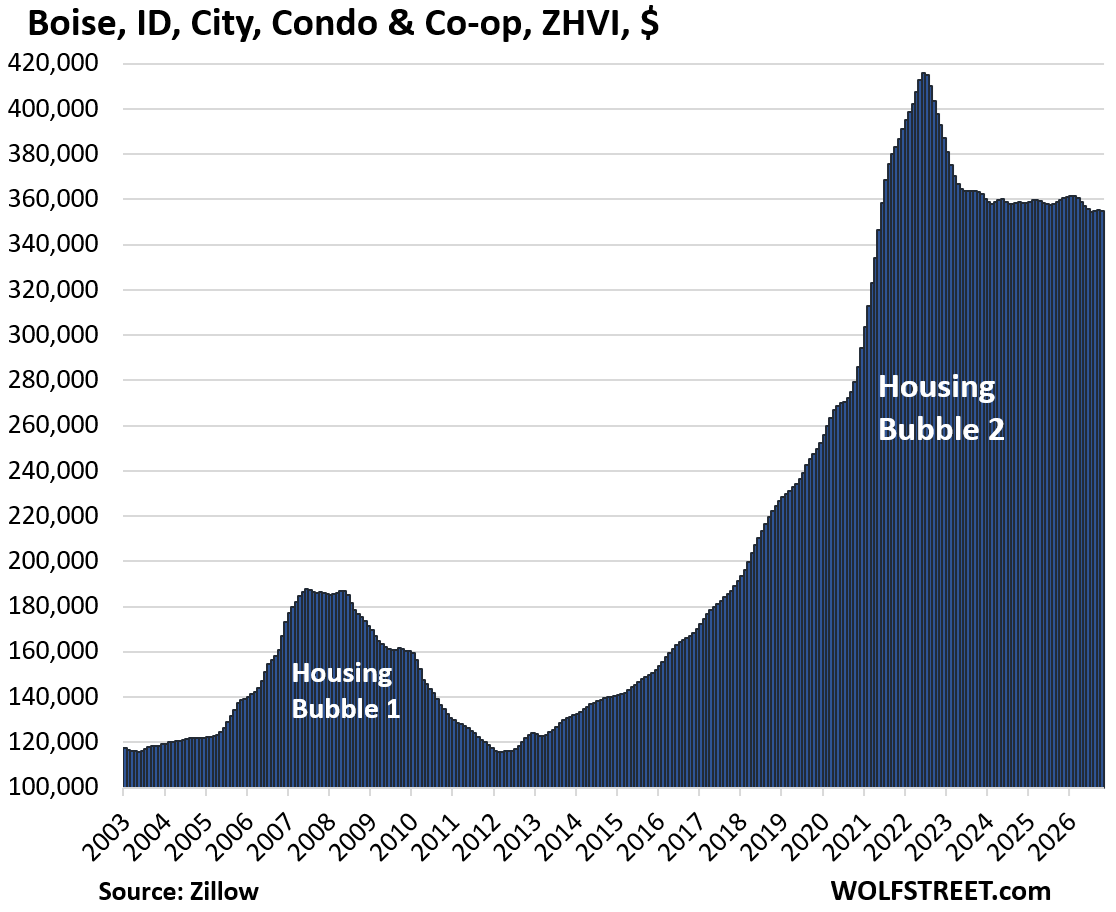
| 39 | Boise, ID | -15% | 2022 |
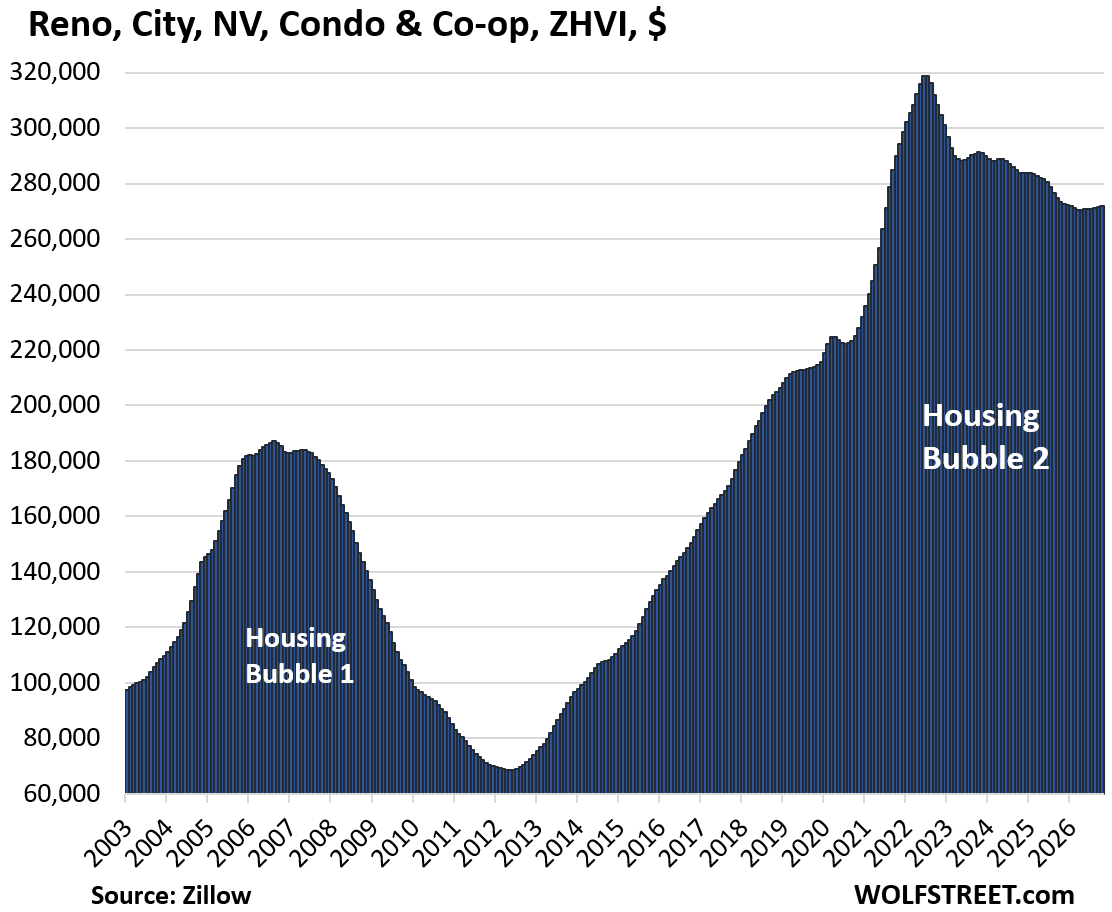
| 40 | Reno, NV | -15% | 2022 |
Cities were prices dropped less than 15%.
There are many markets where condo prices have dropped from their peaks in prior years, but by less than 15% so far.
Here is a sample of 28 bigger cities where condo prices have dropped by 8% to 14% (they don’t have their own charts here).
| Mid-tier condo prices fell by 8% to 14% | |||
| Condo Market | Since peak | Year of peak | |
| 1 | Queens, NY | -14% | 2022 |
| 2 | Colorado Springs, CO | -14% | 2022 |
| 3 | Las Vegas, NV | -14% | 2022 |
| 4 | Stockton, CA | -14% | 2022 |
| 5 | Modesto, CA | -14% | 2022 |
| 6 | Scottsdale, AZ | -14% | 2022 |
| 7 | Henderson, NV | -13% | 2022 |
| 8 | Corpus Christi, TX | -13% | 2023 |
| 9 | Atlanta, GA | -12% | 2023 |
| 10 | Spokane, WA | -11% | 2022 |
| 11 | San Jose, CA | -11% | 2022 |
| 12 | Nashville, TN | -11% | 2022 |
| 13 | Washington, DC | -10% | 2022 |
| 14 | Los Angeles, CA | -10% | 2022 |
| 15 | Tucson, AZ | -10% | 2023 |
| 16 | Memphis, TN | -10% | 2024 |
| 17 | Wilmington, NC | -10% | 2022 |
| 18 | San Diego, CA | -10% | 2023 |
| 19 | Marietta GA | -10% | 2024 |
| 20 | Minneapolis, MN | -9% | 2021 |
| 21 | Salt Lake City, UT | -9% | 2022 |
| 22 | Fort Worth, TX | -9% | 2024 |
| 23 | Long Beach, CA | -9% | 2023 |
| 24 | St. Louis, MO | -9% | 2023 |
| 25 | Oklahoma City, OK | -8% | 2023 |
| 26 | New Orleans | -8% | 2022 |
| 27 | Lubbock, TX | -8% | 2022 |
| 28 | Miami, FL | -8% | 2023 |
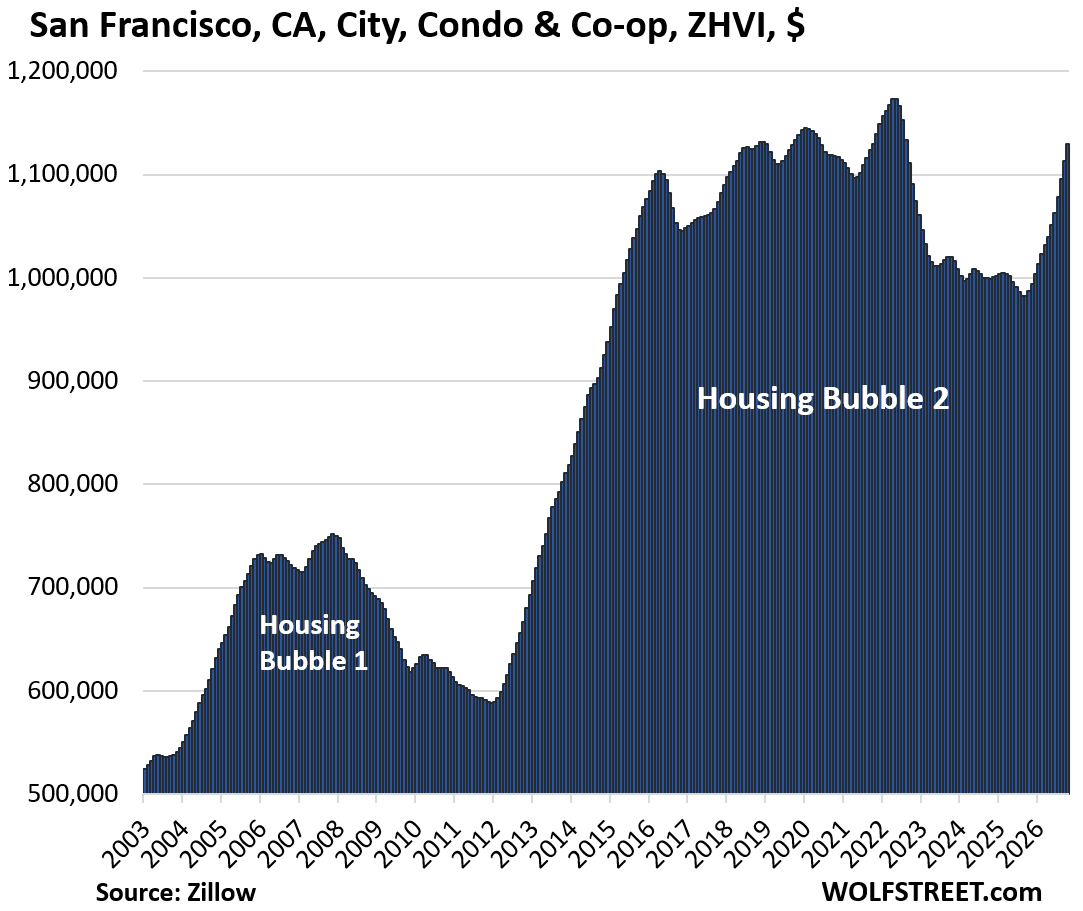
San Francisco, the epicenter of AI mania, came off this list entirely earlier this year because condo prices have been exploding, along with single-family home prices and rents, driven by the tsunami of money that AI companies headquartered in the City, particularly Anthropic and OpenAI, have been throwing in all directions, including via stock-based compensation.
Year-over-year, prices of mid-tier condos spiked by 14% in San Francisco, but they’re still 4% below their peak in mid-2022.
| San Francisco, CA, City, Condo Prices | |||
| From May 2022 peak | MoM | YoY | Since 2000 |
| -4% | 1.5% | 14.4% | 177% |
Methodology and data: These prices here are seasonally adjusted three-month averages of “mid-tier” condos and co-ops from the Zillow Home Value Index (ZHVI), which is backward-looking index, based on millions of data points in Zillow’s “Database of All Homes,” including from public records (tax data), MLS, brokerages, local Realtor Associations, real-estate agents, and households across the US. It includes pricing data for off-market deals and for-sale-by-owner deals.
How Condo Bubbles deflate in charts.
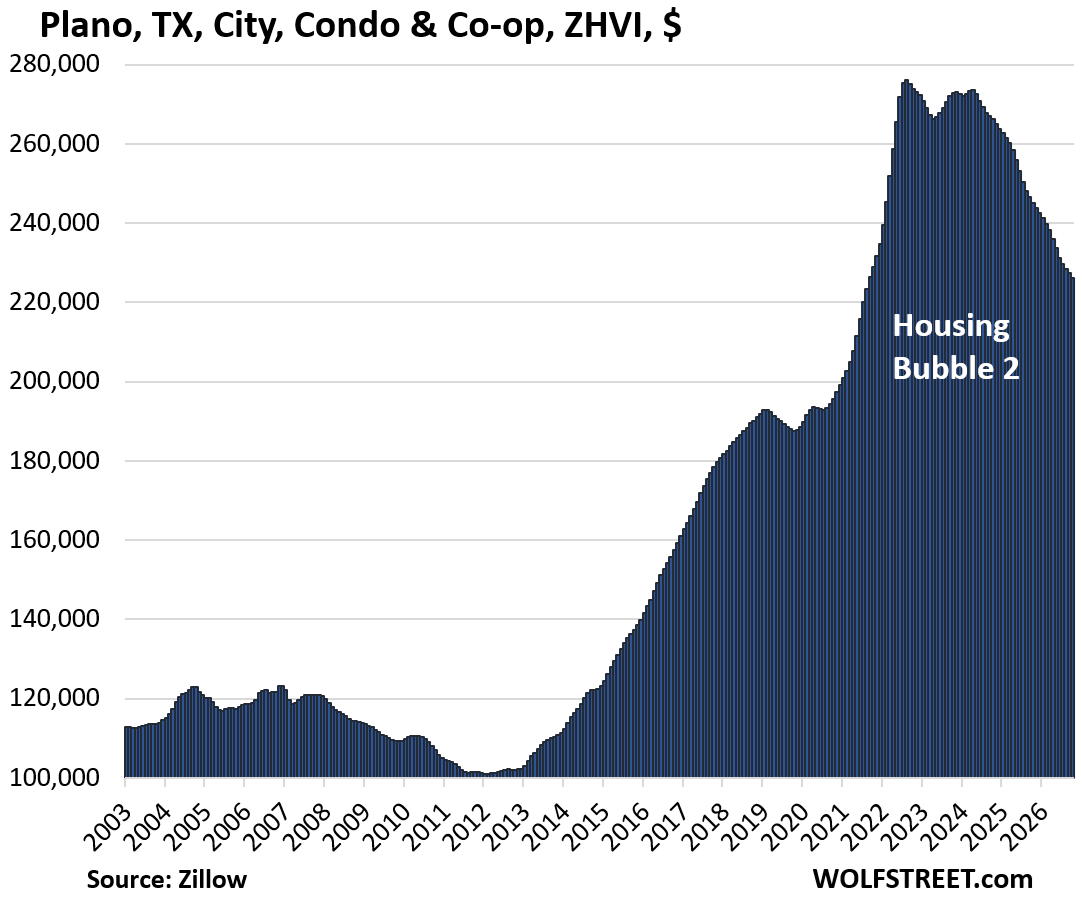
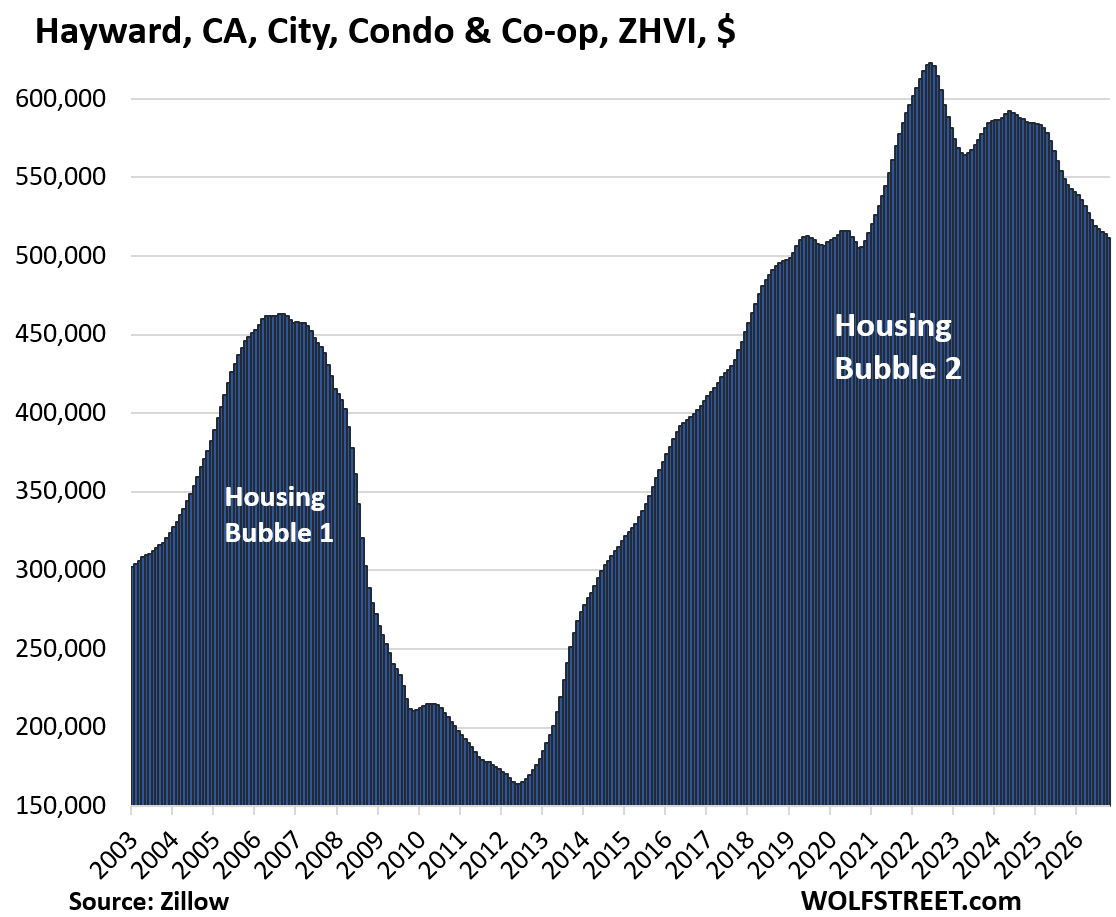
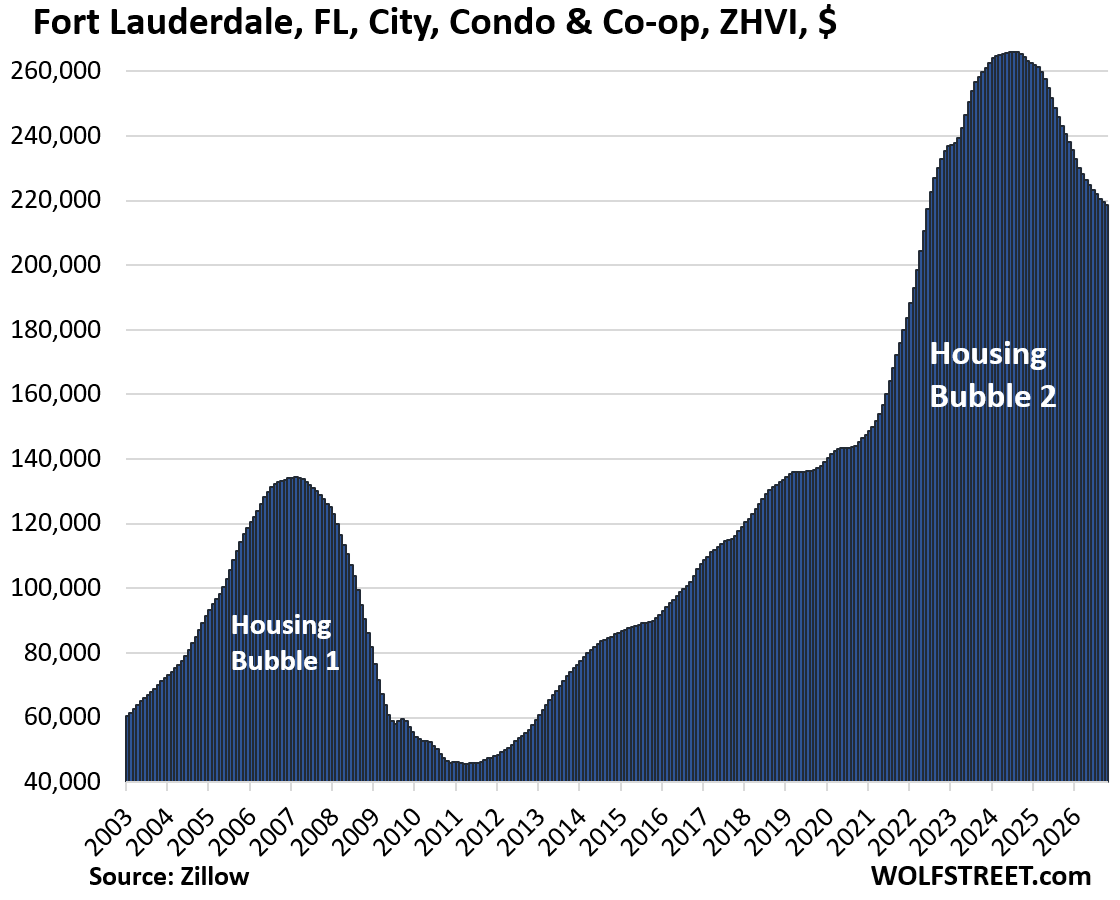
The tables for each market below show from left to right for mid-tier condo prices: decline from the peak, change from prior month (MoM), change year-over-year (YoY), and remaining increase since January 2000.
| Cape Coral, City, FL, Condo Prices | |||
| From July 2022 peak | MoM | YoY | Since 2000 |
| -34% | -0.3% | -6.5% | 124% |
| Oakland, CA, City, Condo Home Prices | |||
| From May 2022 peak | MoM | YoY | Since 2000 |
| -32% | -0.4% | -5.5% | 139% |
| St. Petersburg, Fl, City, Condo Prices | |||
| From Oct 2022 peak | MoM | YoY | Since 2000 |
| -30% | -0.2% | -5.0% | 174% |
| Austin, TX, City, Condo Prices | |||
| From Jul 2022 peak | MoM | YoY | Since 2000 |
| -29% | -0.3% | -5.2% | 101% |
| Fort Myers, FL, City, Condo Prices | |||
| From July 2022 peak | MoM | YoY | Since 2000 |
| -28% | -0.2% | -6% | 117% |
| Sarasota County, FL, Condo & Co-ops Prices | |||
| From Jun 2022 peak | MoM | YoY | Since 2000 |
| -24% | 0.2% | -2.6% | 131% |
| Garland, TX, City, Condo Prices | |||
| From July 2022 peak | MoM | YoY | Since 2000 |
| -23% | -0.6% | -11.6% | 196% |
| Tampa, FL, City, Condo Prices | |||
| From Sep 2022 peak | MoM | YoY | Since 2000 |
| -22% | -0.4% | -6.2% | 238% |
| Jacksonville, FL, City, Condo Prices | |||
| From Nov 2022 peak | MoM | YoY | Since 2000 |
| -22% | -0.4% | -6.0% | 134% |
| Arlington, TX, City, Condo Prices | |||
| From Jun 2024 peak | MoM | YoY | Since 2000 |
| -21% | -1.1% | -6.2% | 238% |
| Denver, CO, City, Condo Prices | |||
| From Jul 2022 peak | MoM | YoY | Since 2000 |
| -20% | -0.6% | -5.6% | 123% |
| Aurora, CO, City, Condo Prices | |||
| From Jul 2022 peak | MoM | YoY | Since 2000 |
| -20% | -0.5% | -6.4% | 184% |
| Orlando, FL, City, Condo Prices | |||
| From Jan 2024 peak | MoM | YoY | Since 2000 |
| -19% | -0.6% | -6.5% | 140.6% |
| Lakeland-Winter Haven, FL, MSA, Condo Prices | |||
| From July 2022 peak | MoM | YoY | Since 2000 |
| -19% | -0.3% | -6.5% | 116% |
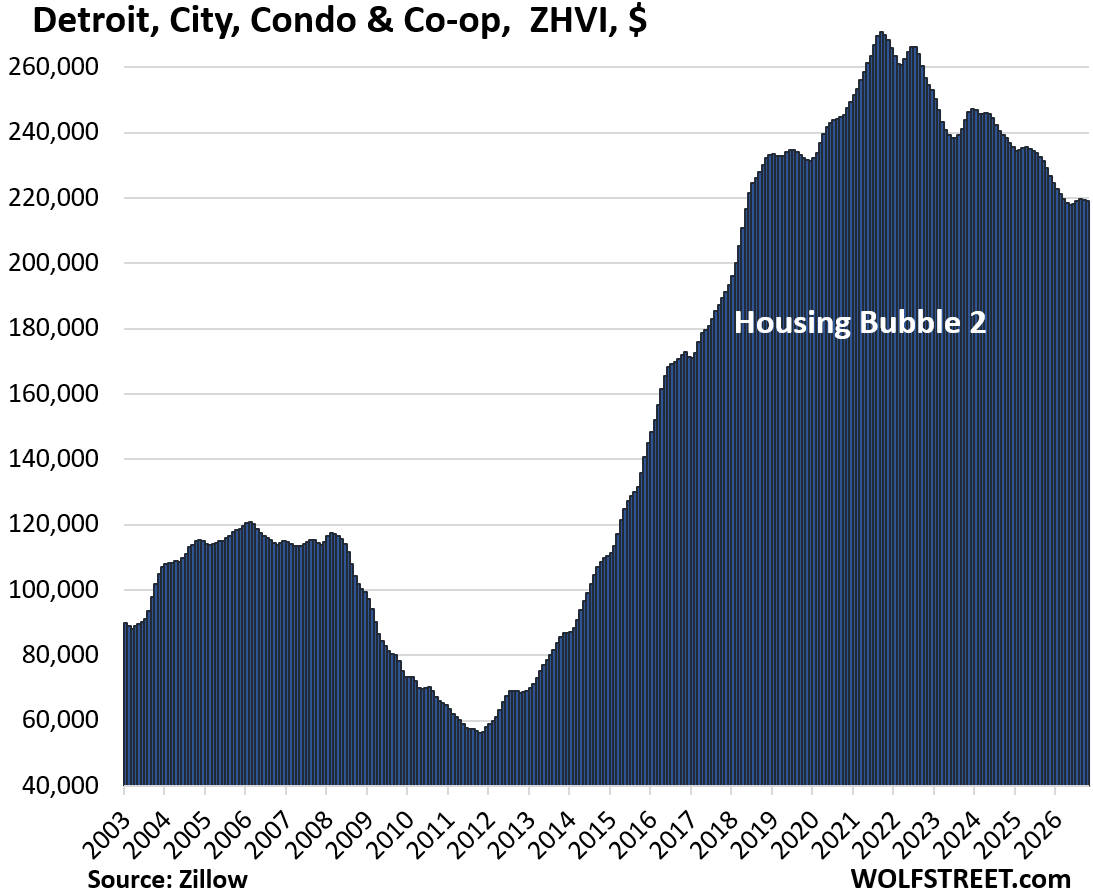
| Detroit, MI, City, Condo Prices | |||
| From Sep 2021 peak | MoM | YoY | Since 2000 |
| -19% | -0.2% | -4.4% | 252% |
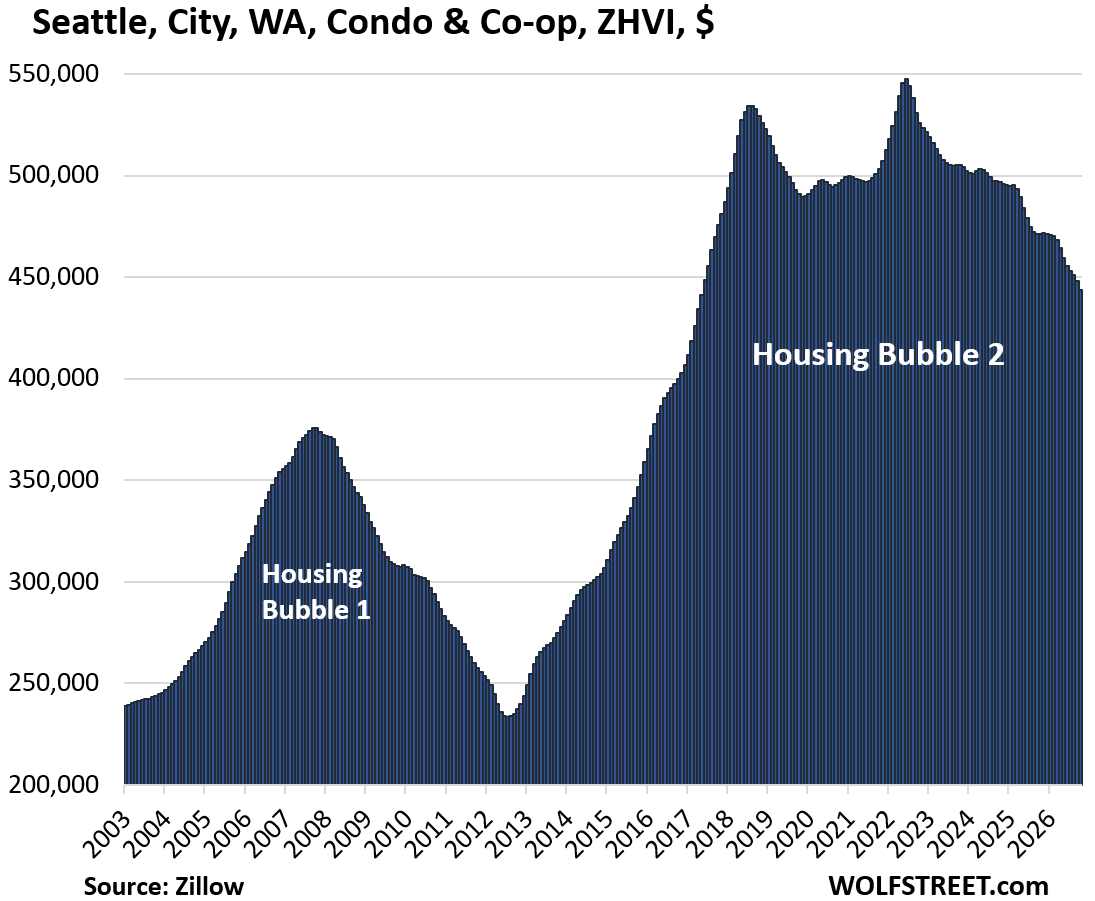
| Seattle, WA, City, Condo Prices | |||
| From Jun 2022 peak | MoM | YoY | Since 2000 |
| -19% | -0.9% | -5.9% | 126% |
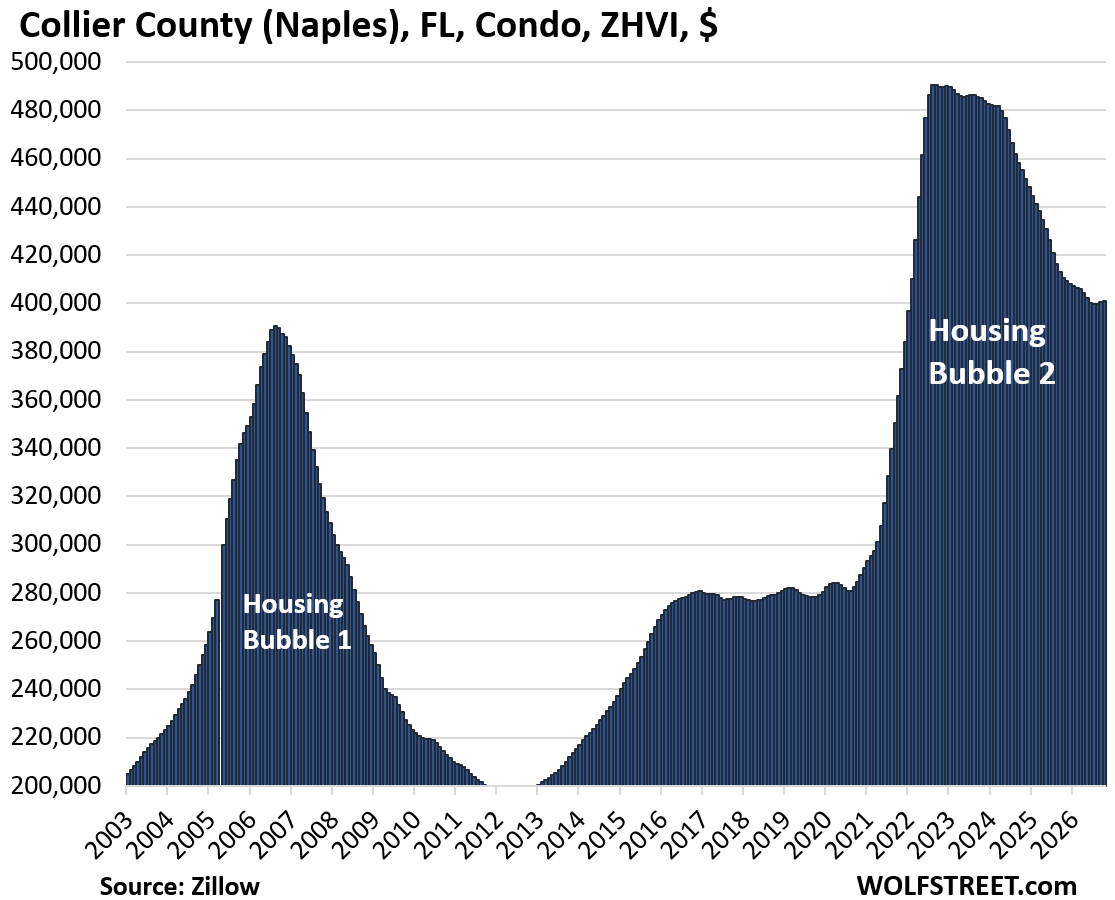
| Collier County (Naples), FL, Condo & Co-ops Prices | |||
| From Jun 2022 peak | MoM | YoY | Since 2000 |
| -18% | 0.1% | -2.4% | 153% |
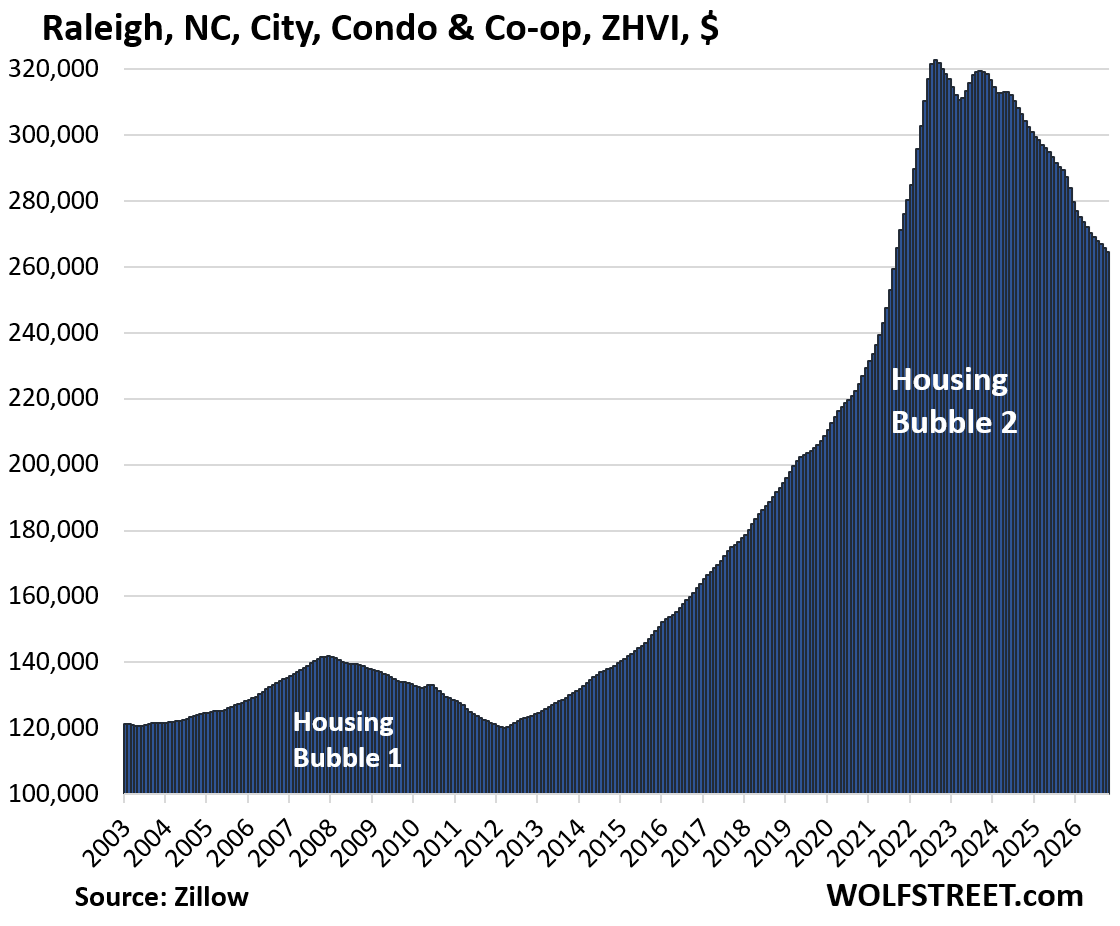
| Raleigh, NC, City, Condo Prices | |||
| From July 2022 peak | MoM | YoY | Since 2000 |
| -18% | -0.5% | -7.9% | 126.5% |
| Plano, TX, City, Condo Prices | |||
| From Aug 2023 peak | MoM | YoY | Since 2000 |
| -18% | -0.5% | -7.7% | 118% |
| Hayward, CA, City, Condo Prices | |||
| From July 2022 peak | MoM | YoY | Since 2000 |
| -18% | -0.4% | -6.2% | 171% |
| Fort Lauderdale, FL City, Condo & Co-op Prices | |||
| From Jul 2024 peak | MoM | YoY | Since 2000 |
| -18% | -0.6% | -6.5% | #DIV/0! |
| Contra Costa County (East Bay), CA, Condo & Co-Op Prices | |||
| From Jun 2022 peak | MoM | YoY | Since 2000 |
| -17% | -0.4% | -3.9% | 130% |
| Port Saint Lucie, FL, City, Condo Prices | |||
| From July 2022 peak | MoM | YoY | Since 2000 |
| -17% | -0.1% | -4.8% | 218.5% |
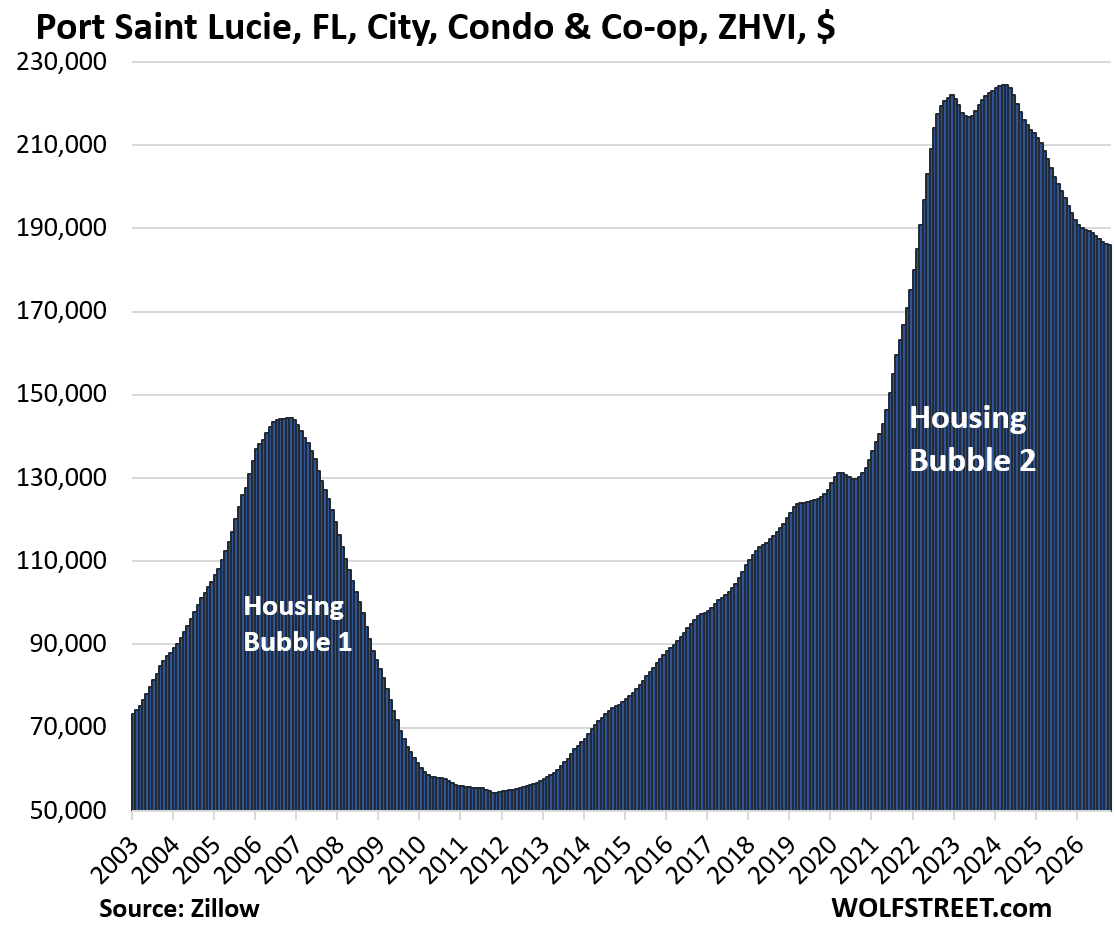
| Mesa, AZ, City, Condo Prices | |||
| From Aug 2022 peak | MoM | YoY | Since 2000 |
| -17% | -0.4% | -5.2% | 189% |
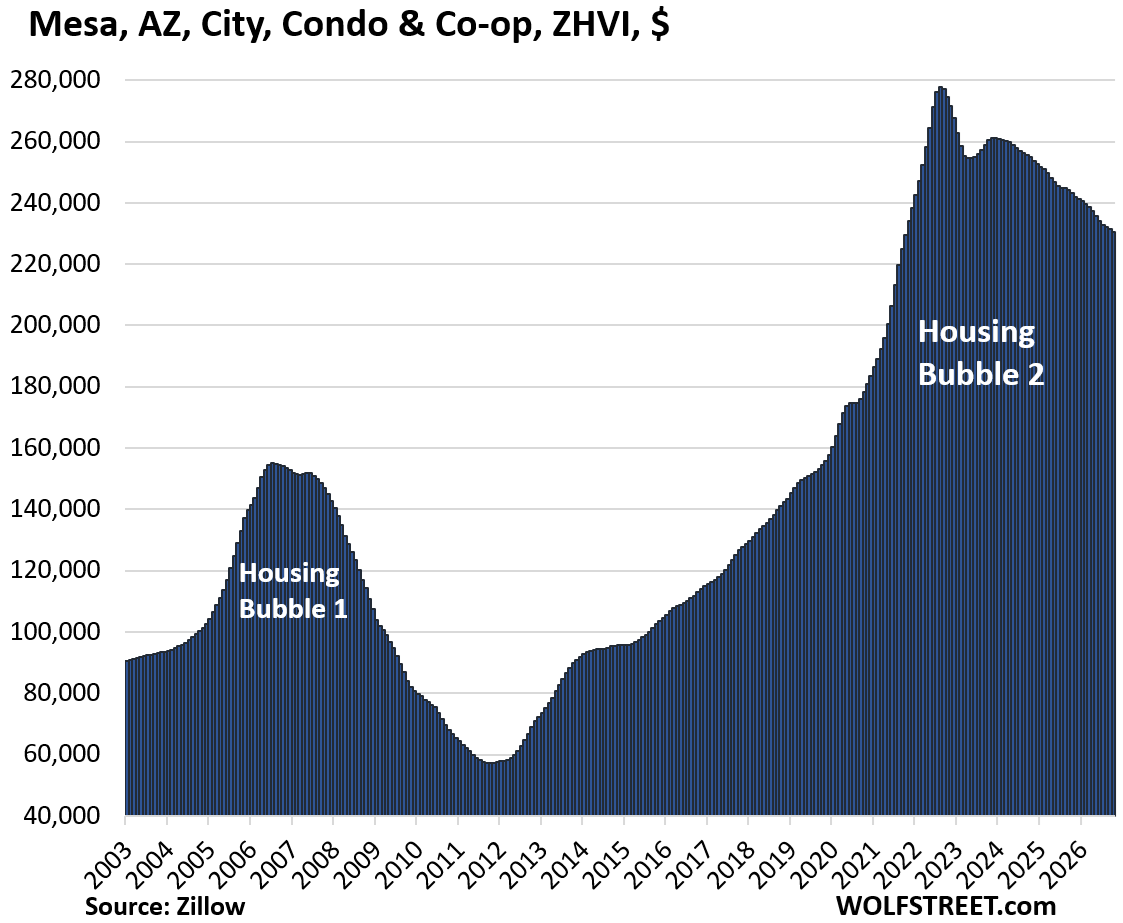
| Fremont, CA, City, Condo Prices | |||
| From May 2022 peak | MoM | YoY | Since 2000 |
| -17% | -0.4% | -5.8% | 188.2% |
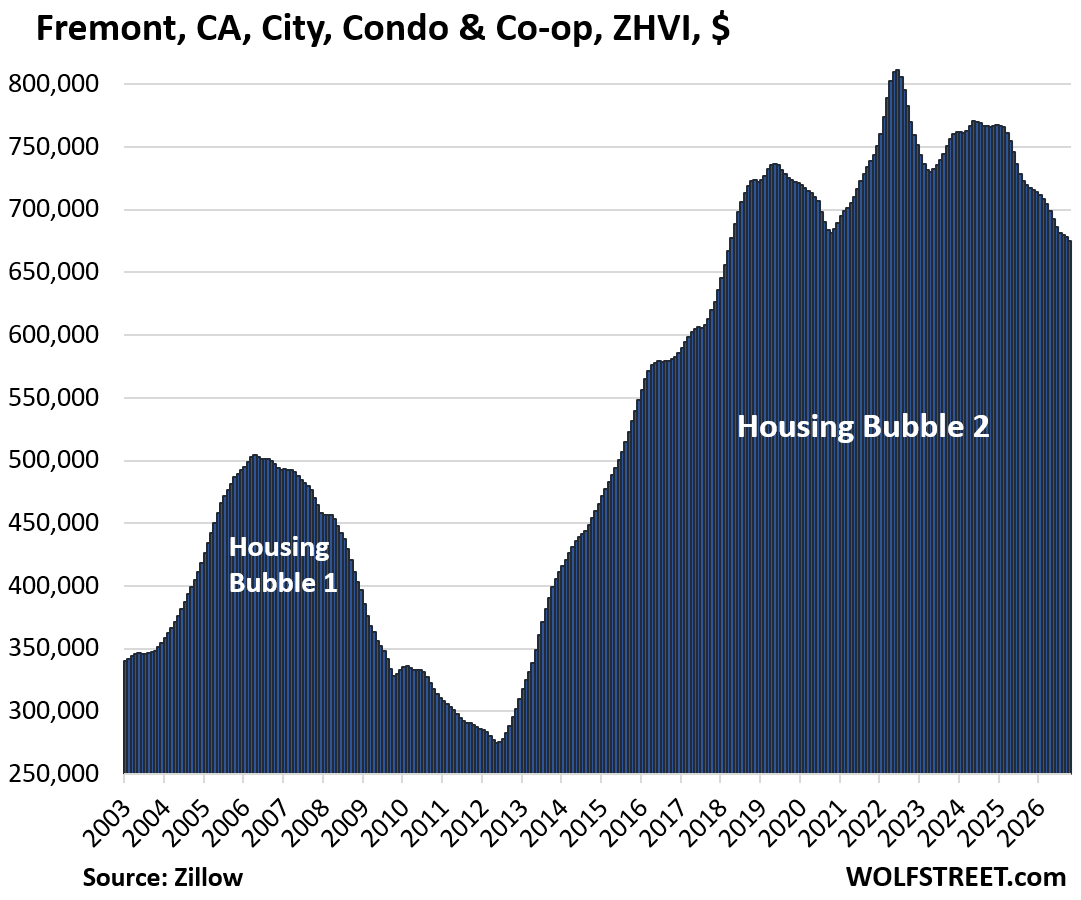
| Portland, OR, City, Condo Prices | |||
| From Jun 2022 peak | MoM | YoY | Since 2000 |
| -16% | -0.5% | -3.7% | 103% |
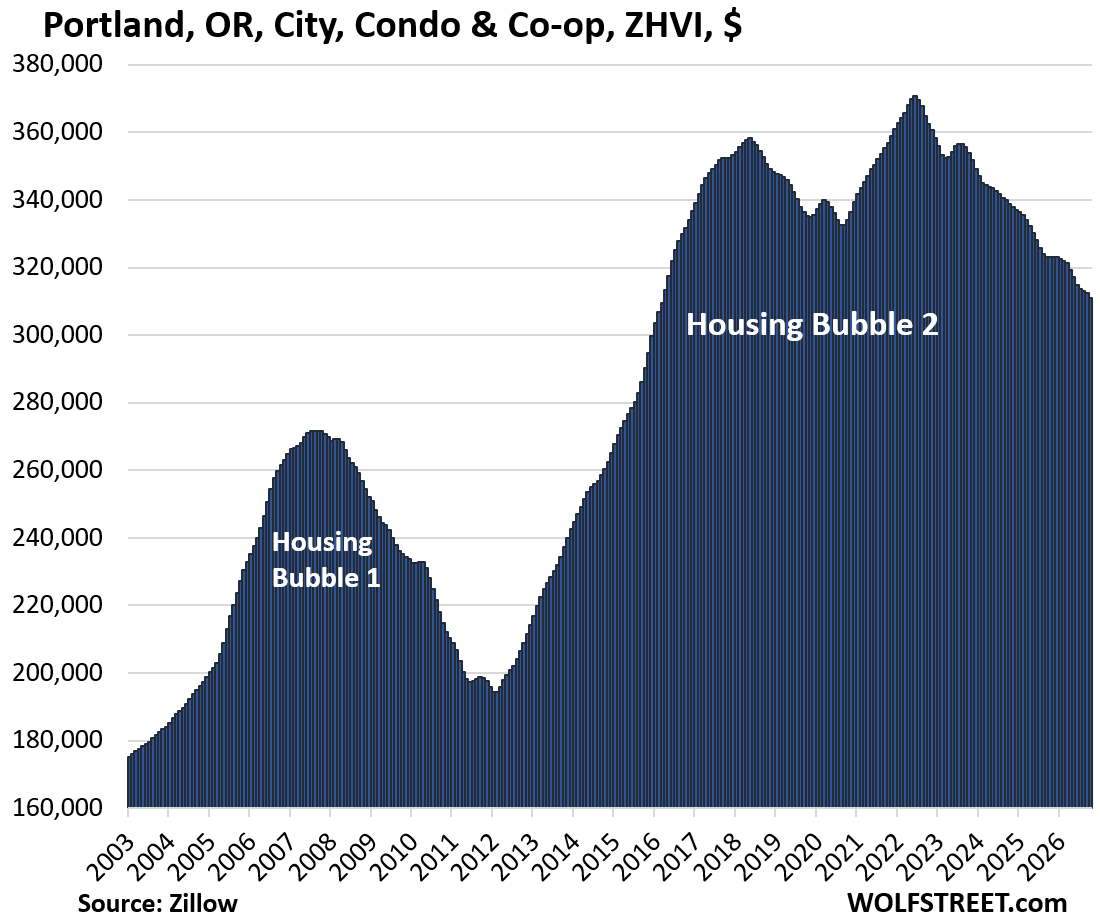
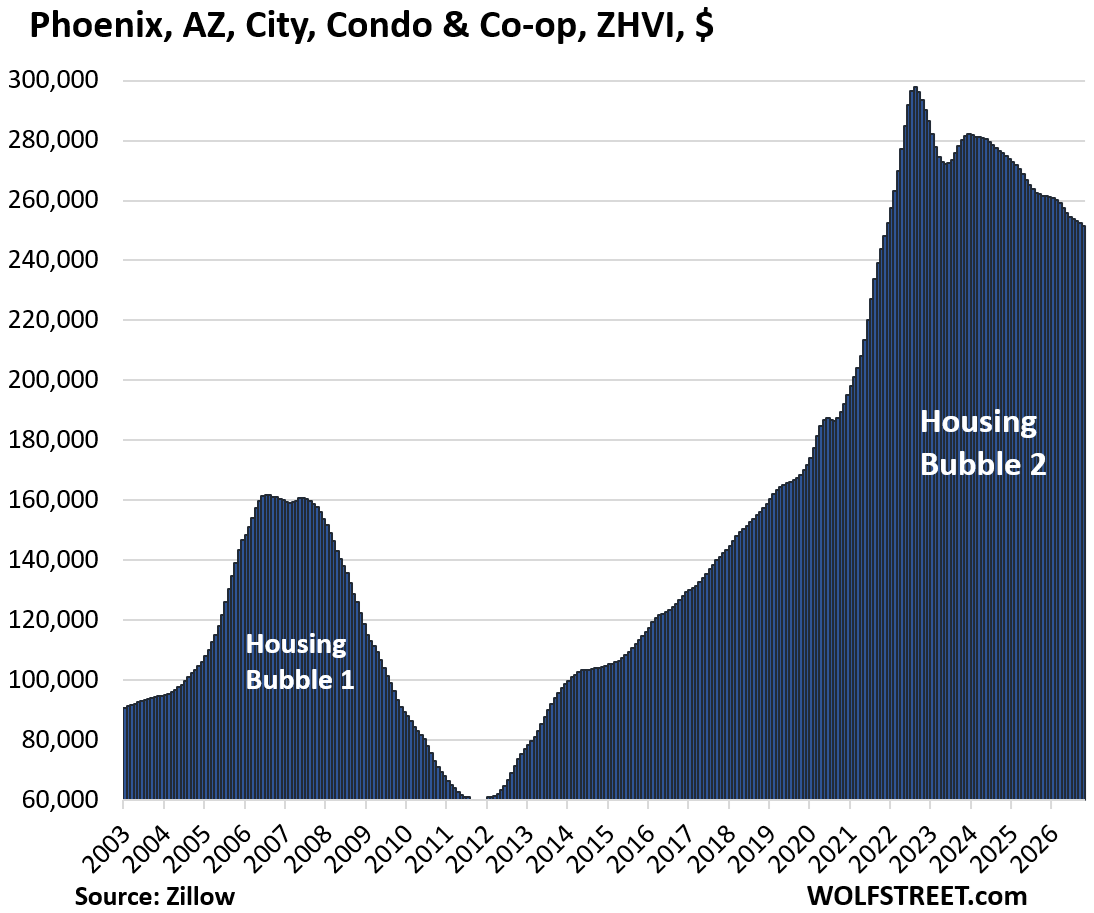
| Chandler, AZ, City, Condo Prices | |||
| From Aug 2022 peak | MoM | YoY | Since 2000 |
| -16% | -0.4% | -4.7% | 201.9% |
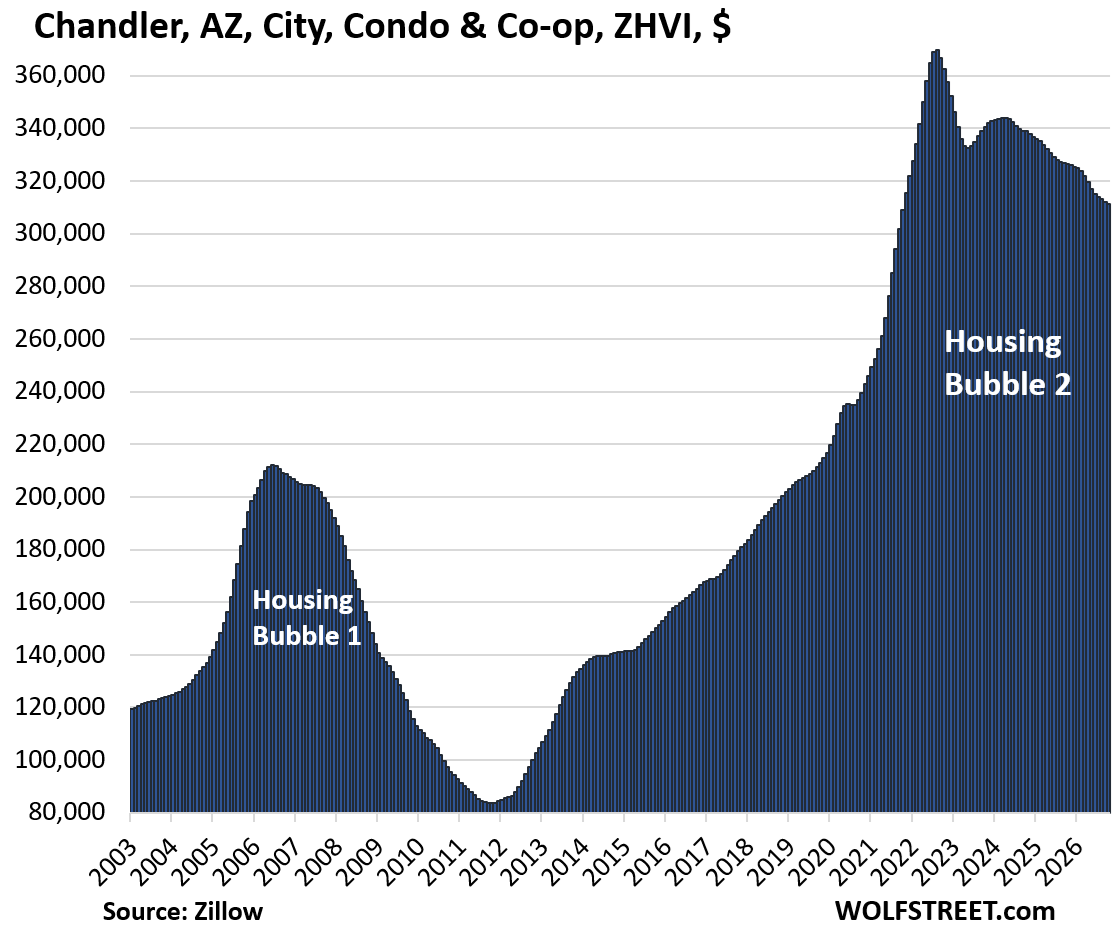
| Houston, TX, City, Condo Prices | |||
| From Aug 2023 peak | MoM | YoY | Since 2000 |
| -16% | -0.7% | -6.1% | 61% |
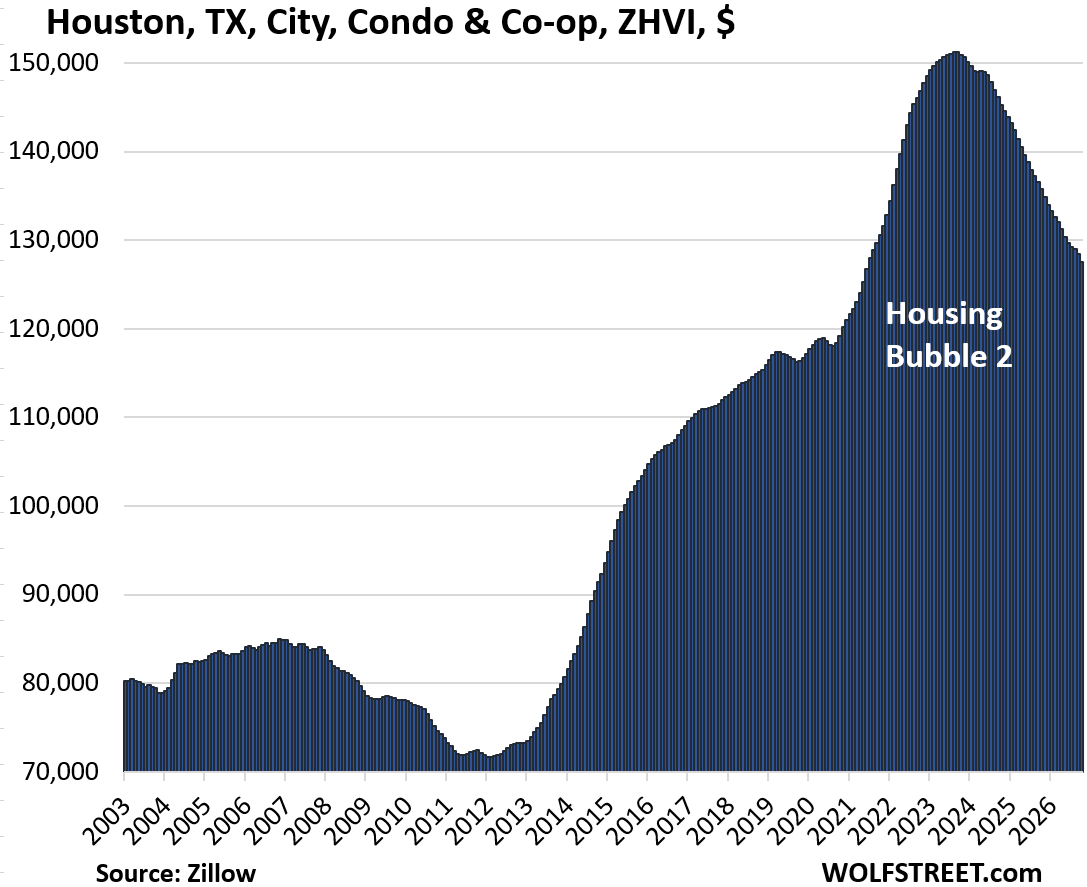
| Glendale, AZ, City, Condo Prices | |||
| From July 2022 peak | MoM | YoY | Since 2000 |
| -16% | -1% | -6% | 228% |
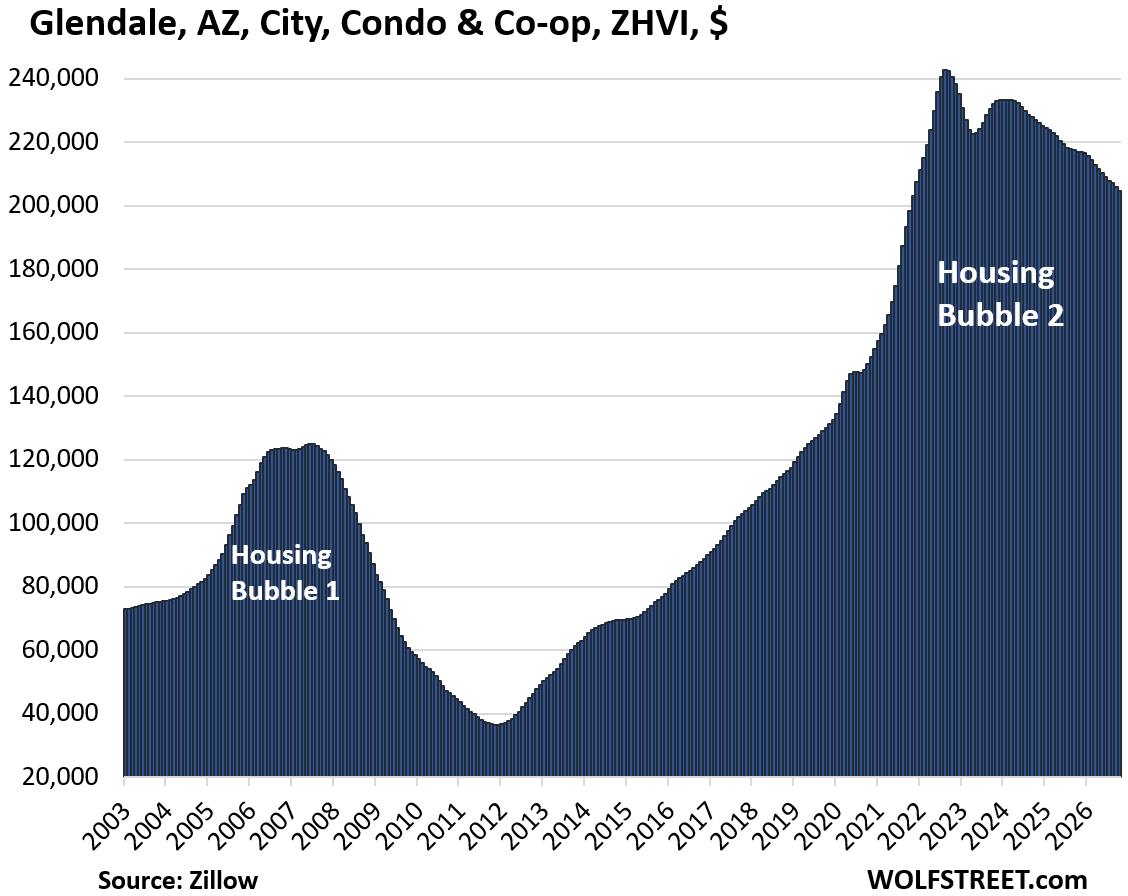
| Phoenix, AZ, City, Condo Prices | |||
| From Aug 2022 peak | MoM | YoY | Since 2000 |
| -15% | -0.4% | -3.8% | 223% |
| Irving, TX, City, Condo Prices | |||
| From May 2024 peak | MoM | YoY | Since 2000 |
| -15% | -0.6% | -6.0% | 130% |
| Tempe, AZ, City, Condo Prices | |||
| From Jul 2022 peak | MoM | YoY | Since 2000 |
| -15% | -0.2% | -5.4% | 154.8% |
| San Mateo County, CA, Condo & Co-op Prices | |||
| From Jun 2022 peak | MoM | YoY | Since 2000 |
| -15% | 0.1% | -1.3% | 194% |
| San Antonio, TX, City, Condo Prices | |||
| From Aug 2023 peak | MoM | YoY | Since 2000 |
| -15% | -0.5% | -4.1% | 120% |
| Dallas, TX, City, Condo Prices | |||
| From Oct 2023 peak | MoM | YoY | Since 2000 |
| -15% | -0.3% | -6.4% | 141% |
| Sacramento, CA, City, Condo Prices | |||
| From Jun 2022 peak | MoM | YoY | Since 2000 |
| -15% | -0.4% | -5.2% | 262% |
| Boise, ID, City, Condo Prices | |||
| From Jun 2022 peak | MoM | YoY | Since 2001 |
| -15% | -0.2% | -1% | #DIV/0! |
| Reno, NV, City, Condo Prices | |||
| From Jun 2022 peak | MoM | YoY | Since 2000 |
| -15% | 0.2% | -0.4% | 242% |
A reminder of the special issues condos face:
- Over the long term, land appreciates, but most buildings depreciate and are eventually torn down. The land that big condo buildings sit on can be very valuable, but each condo owner only owns a tiny slice of it. The rest of their investment is in the building. A single-family house may sit on less valuable land, but the homeowner owns all of it.
- Prices that exploded over the past few years ended up being way too high, once the mania settled down.
- Hefty special assessments, or the fear of them, for long-neglected major repairs dog some older condo buildings. This is a particular issue in Florida, but elsewhere too.
- Big increases in HOA fees at many properties, partly driven by spiking insurance costs in natural disaster zones, add substantially to the monthly costs of condos.
- If a condo building is on Fannie Mae’s Blacklist, financing a unit in that building can be difficult, and sales may be limited to cash buyers who know that and exact their pound of flesh.
- The Free Money has ended, and mortgage rates are roughly back to a normal range. Buyers of single-family homes face the same issue.
- Foreign-based owners who’ve become frustrated with the US and became sellers add supply, while demand from foreign buyers has waned.
- Investors in condos as rental properties are facing stiff competition from a wave of newly completed higher-end apartment buildings that developers are trying to find tenants for.