Here Come the HELOCs: Mortgages, Housing-Debt-to-Income-Ratio, Serious Delinquencies, and Foreclosures in Q3 2026


Keeping an eye on the debt-to-income ratio, which set off all alarm bells before the Housing Bust; but so far, so good.
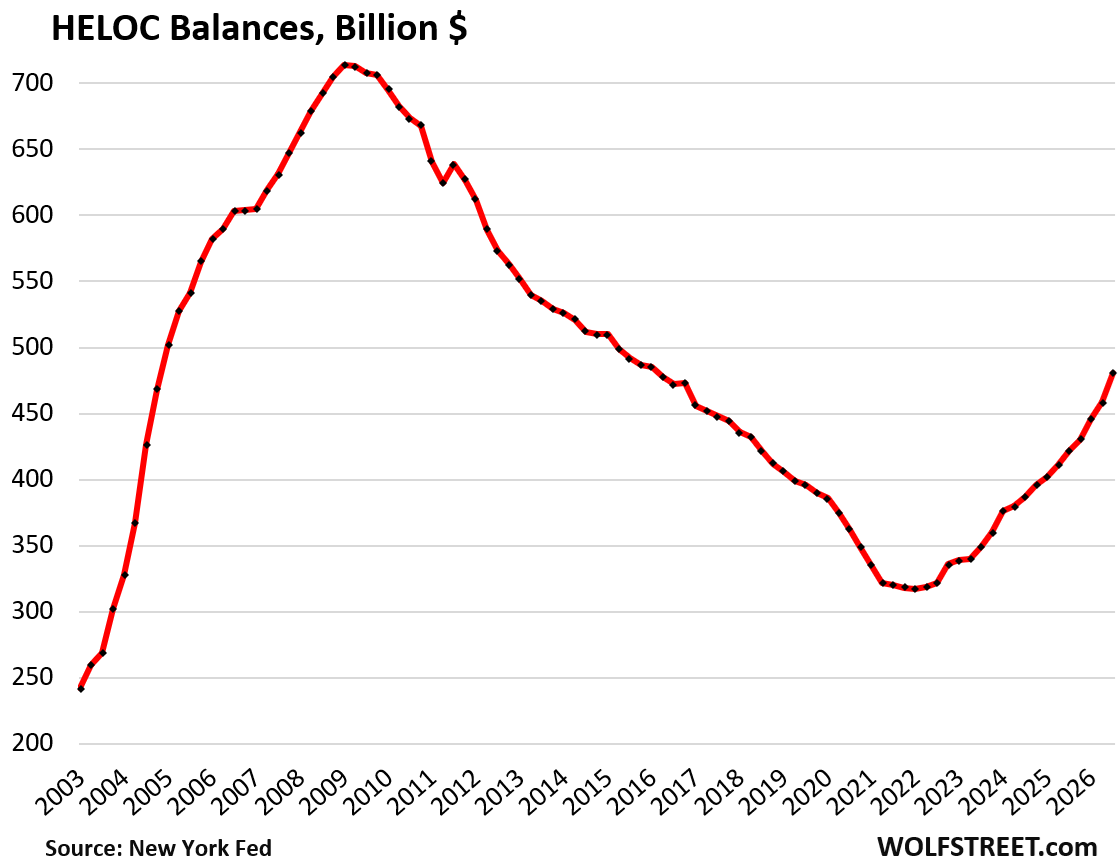
Mortgage balances rose by $257 billion in Q3, to $13.37 trillion, after having declined in Q2, according to the Household Debt and Credit Report from the New York Fed, which gets the data from Equifax.
The decline in Q2 had been “due to a temporary gap in the reporting of mortgages on credit reports due to a transfer of servicing,” the New York Fed had explained at the time. And now the missed mortgage data from Q2 was included in Q3, which caused part of the jump, after the decline.
Year-over-year, mortgage balances rose by $302 billion, or by 2.3%.
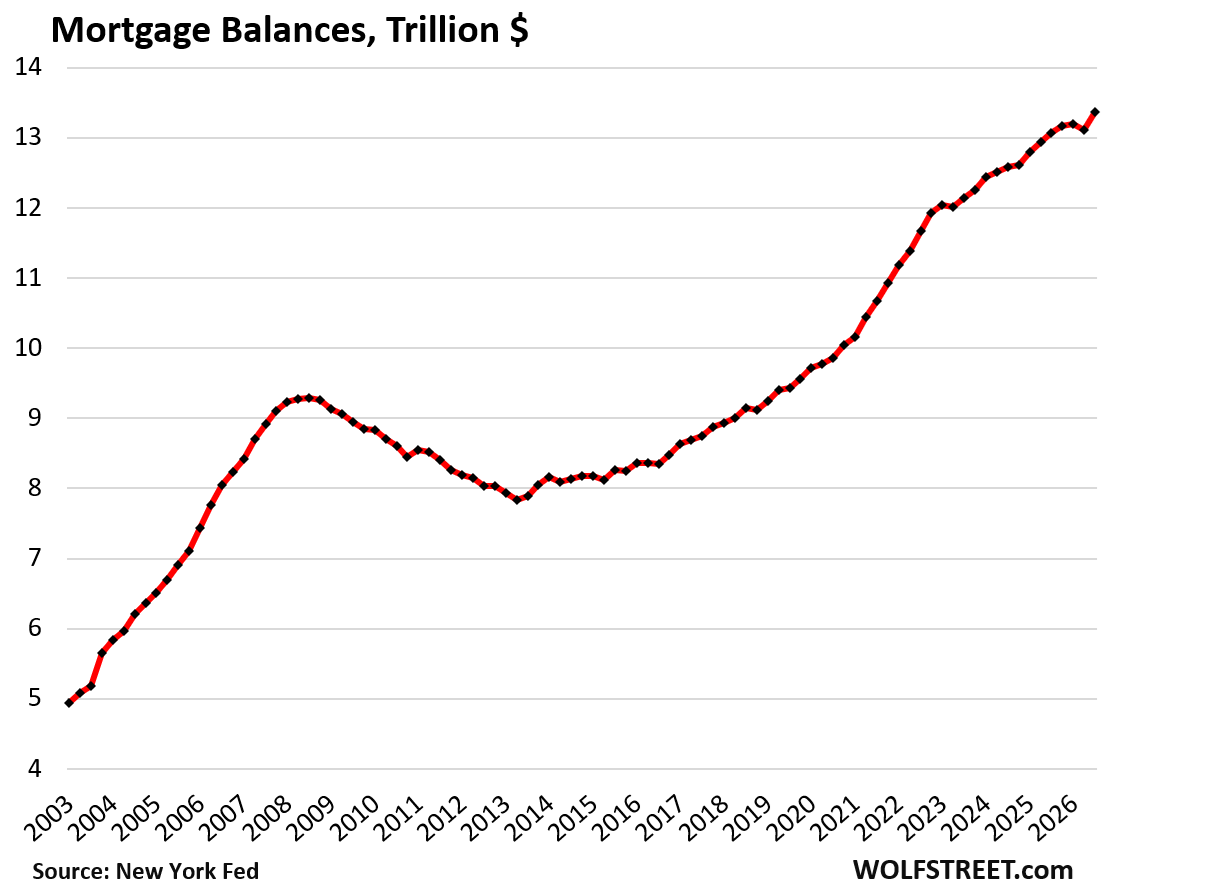
Here come the HELOCs: +52% since Q1 2021.
Balances of Home Equity Lines of Credit spiked by 4.9% in Q3, and by 14.0% year-over-year, to $481 billion in actual balances drawn on HELOCs (not including the unused portion of the credit lines).
Since the low point in 2021, HELOC balances have surged by 52%.
HELOCs are second-lien loans on the home. They increase leverage and, if defaulted on, can lead to foreclosure and loss of the home, even if the first-lien mortgage is current. HELOCs add an additional layer of risk for homeowners, lenders, and the mortgage market, and they did some additional damage during the Housing Bust and Mortgage Crisis.
HELOC versus cash-out refinancing. If homeowners want to pull cash out of their home equity, they can choose between refinancing the entire existing mortgage with a larger new mortgage; or keeping the existing mortgage and adding a much smaller second-lien mortgage, such as a HELOC. The math depends on the interest rate of the original mortgage. If that’s a 3% mortgage with a big balance, homeowners wanting to extract cash would be tilting to a HELOC, and so HELOC balances have been surging.
The burden of housing debt and defaults.
A debt-to-income ratio is a standard metric to evaluate the burden of a debt for the purpose of gauging credit risk (risk of default) – and in this case, the economy-wide credit risk. To get total “housing debt,” I combine all mortgages and HELOCs. And for income, I use disposable income (by the Bureau of Economic Analysis).
Disposable income consists of after-tax wages, plus income from interest, dividends, rentals, farm income, small business income, transfer payments from the government, etc.
But it excludes capital gains, which is where the wealthy make most of their money. Excluded are thereby all incomes from stock-based compensation plans and capital appreciation where billionaires make their billions.
Disposable income has grown over the years because the number of households has grown over the years, and income per household has grown, and it has grown faster than housing debt, so the debt-to-income ratio has declined over the years.
In Q3, the debt-to-income ratio rose to 57.2%, after declining in Q2. The ratios in Q2 and Q3 were the third and fourth lowest in the data, behind only Q2 2020 and Q1 2021 when government payments distorted disposable income.
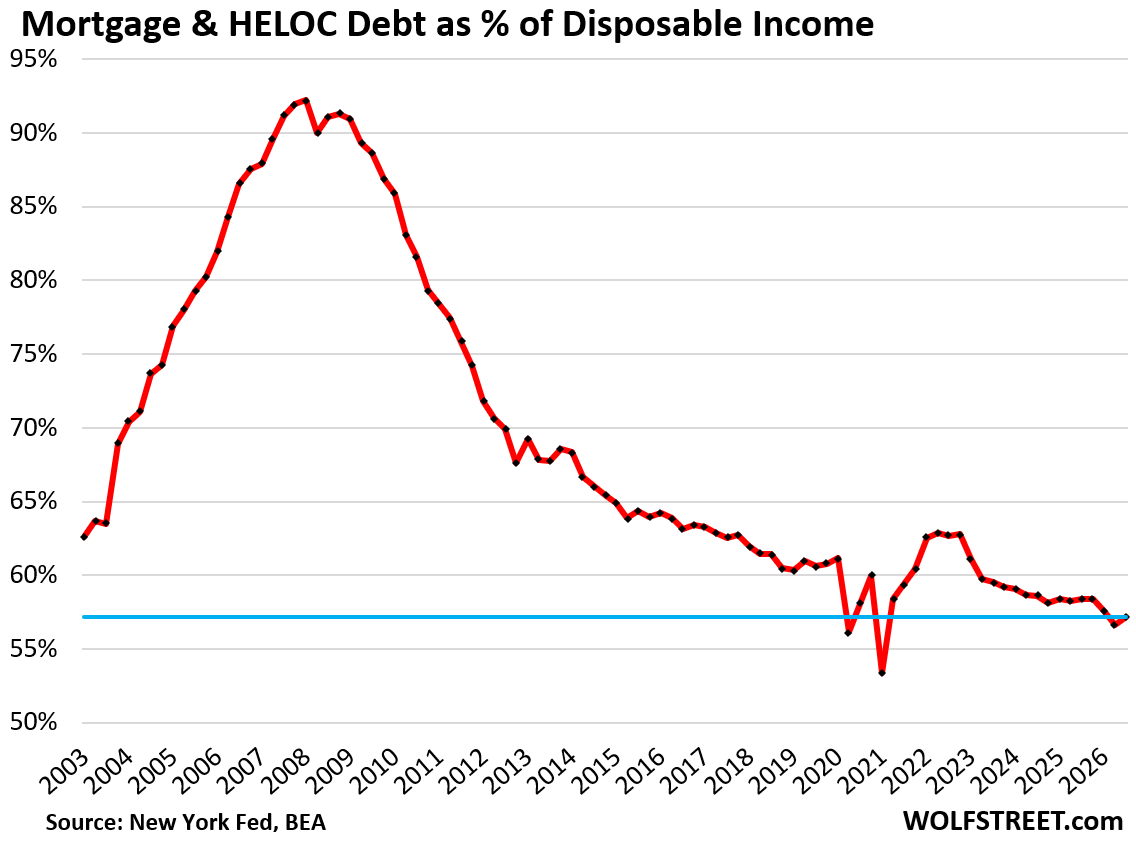
Why we keep an eye on this ratio. In 2007, at the beginning of the Mortgage Crisis, this debt-to-income ratio had gone over 90%! All alarm bells should have sounded long before it got there, and they did but were ignored.
There will always be defaults and foreclosures, triggered by individual events and hardships and miscalculations. The ebbs and flow of economic conditions, such as unemployment, have a broader impact on defaults and foreclosures, but don’t trigger an economy-wide crisis unless leverage is too high.
The widespread mortgage crisis was a result of people being overleveraged in real estate when home prices began to tank.
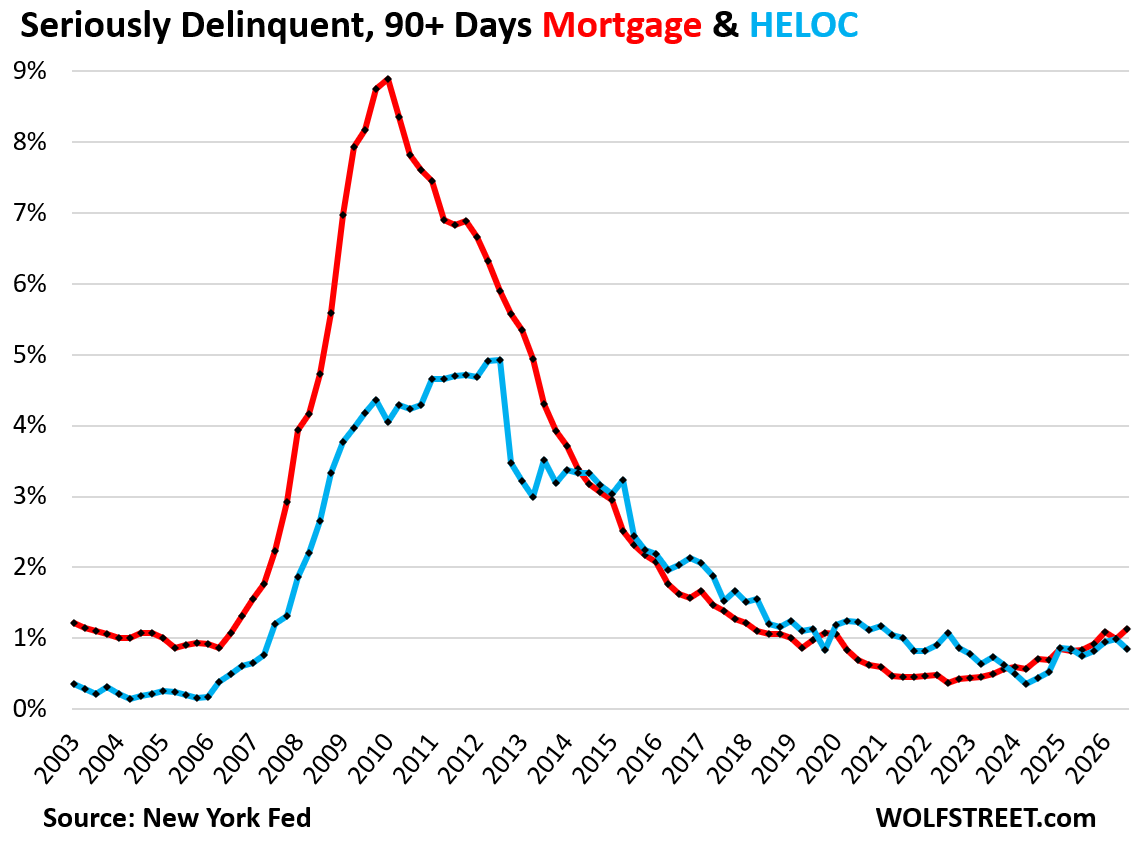
The 90-plus day delinquency rate edged up for mortgages to 1.13% (red) and dipped for HELOCs to 0.85% (blue).
During the pandemic era’s forbearance programs, delinquency status was removed from delinquent mortgages, which had caused delinquency rates to approach 0%.
In Q3, delinquency rates were about where they’d been in 2018 and 2019 and below where they’d been in 2017 and prior years.
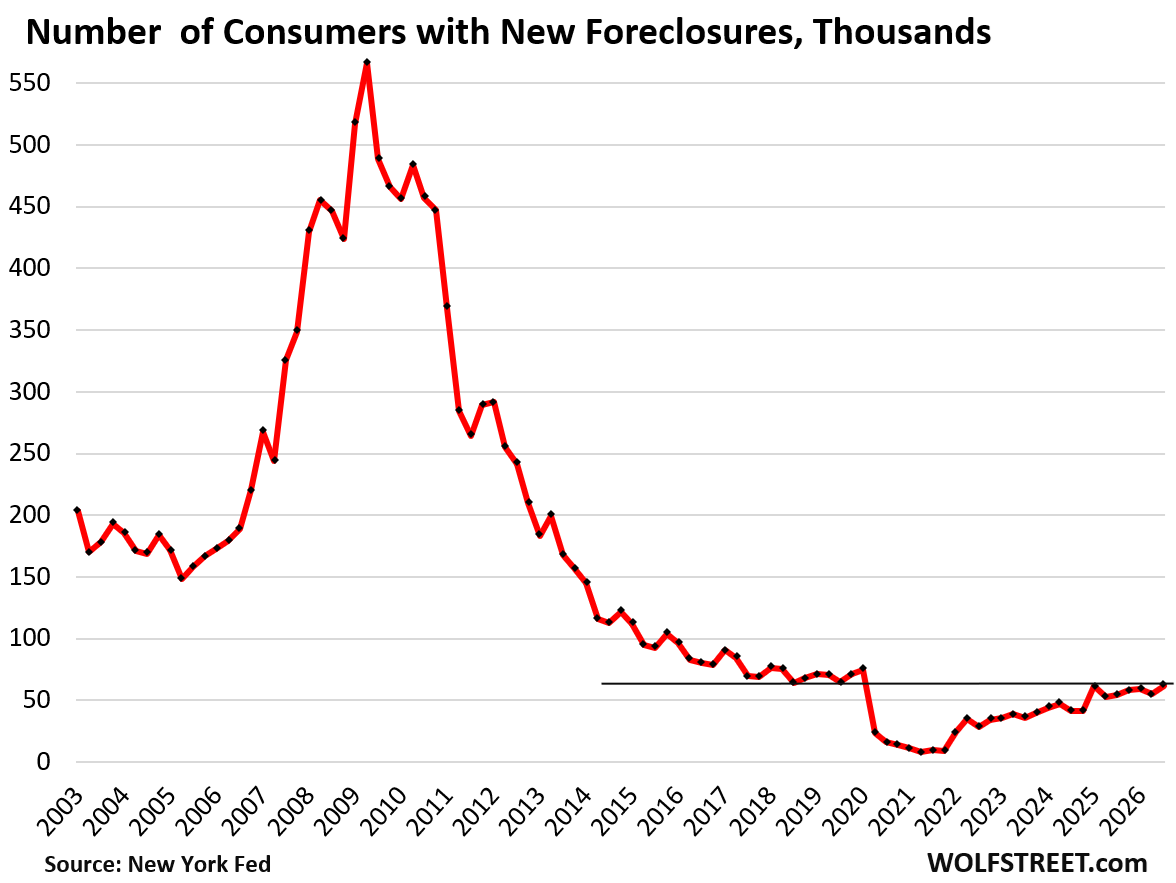
New foreclosures in Q3 rose to 61,900, at the very low end of the three years before the pandemic, far below the number of foreclosures in prior years, and historically low.
During the era of mortgage forbearance and foreclosure bans, foreclosures were essentially impossible.
But now there are some big price declines in some markets, especially with condos, while condo sales have collapsed and supply has spiked.
So I would expect some people, mainly investors who don’t live in their condos, who cannot make the payments and HOA fees, and who cannot sell the condo for enough to pay off the mortgage, to default on the mortgage and end up in foreclosure. But that’s not happening yet in large enough a number to make a visible dent.
Why a housing meltdown won’t topple the banks this time.
About 65% of all mortgages outstanding, including nearly all subprime mortgages, are guaranteed by the US government, via Fannie Mae, Freddie Mac, Ginnie Mae, FHA (which insures subprime mortgages with low down payments), VA, etc. Getting the government explicitly guaranteeing so many mortgages is one of the most fundamental changes since the Financial Crisis.
Investors hold about 15% of the mortgages that didn’t qualify for government backing and that were securitized and sold as “private-label” MBS to bond funds and pension funds around the world.
Banks and credit unions hold less than 20% of the total housing debt, and a mortgage meltdown would ruffle some feathers but not threaten to topple them.
Related Articles
- Forex News
Household Debts, Debt-to-Income Ratios, Delinquencies, Foreclosures, Collections & Bankruptcies in Q3 2026
- Economy News
Canadian household credit holds firm even as mortgage delinquencies rise
- General News
After Decades of Low Mortgage Rates, Homebuyers Are Facing a New Normal
- Economy News
Home sales hit 16-year low in October amid record-high mortgage rates
- Forex News
Despite Lower Rates, Demand for Mortgages to Purchase a Home Is Stuck at Rock-Bottom: Is 7%+ the No-Go Zone?