S&P Global’s (NYSE:SPGI) Q2 CY2026 Sales Top Estimates, but EPS Misses - StockStory


S&P Global’s (NYSE:SPGI) Q2 CY2026 Sales Top Estimates, but EPS Misses
Financial intelligence company S&P Global (NYSE:SPGI) reported Q2 CY2026 results exceeding the market’s revenue expectations, with sales up 10.4% year on year to $4.15 billion. Its non-GAAP profit of $4.83 per share was 3.7% below analysts’ consensus estimates.
Is now the time to buy S&P Global? Find out in our full research report.
S&P Global (SPGI) Q2 CY2026 Highlights:
- Revenue: $4.15 billion vs analyst estimates of $4.11 billion (10.4% year-on-year growth, 1% beat)
- Pre-tax Profit: $1.73 billion (41.7% margin)
- Adjusted EPS: $4.83 vs analyst expectations of $5.02 (3.7% miss)
- Management lowered its full-year Adjusted EPS guidance to $17.63 at the midpoint, a 9.7% decrease
- Market Capitalization: $130.2 billion
Company Overview
Tracing its roots back to 1860 when it published the first railroad industry manual, S&P Global (NYSE:SPGI) provides credit ratings, market intelligence, commodity data, automotive analytics, and financial indices that help investors and businesses make decisions.
Revenue Growth
A company’s long-term sales performance is one signal of its overall quality. Any business can experience short-term success, but top-performing ones enjoy sustained growth for years. Over the last five years, S&P Global grew its revenue at a decent 9% compounded annual growth rate. Its growth was slightly above the average financials company and shows its offerings resonate with customers.
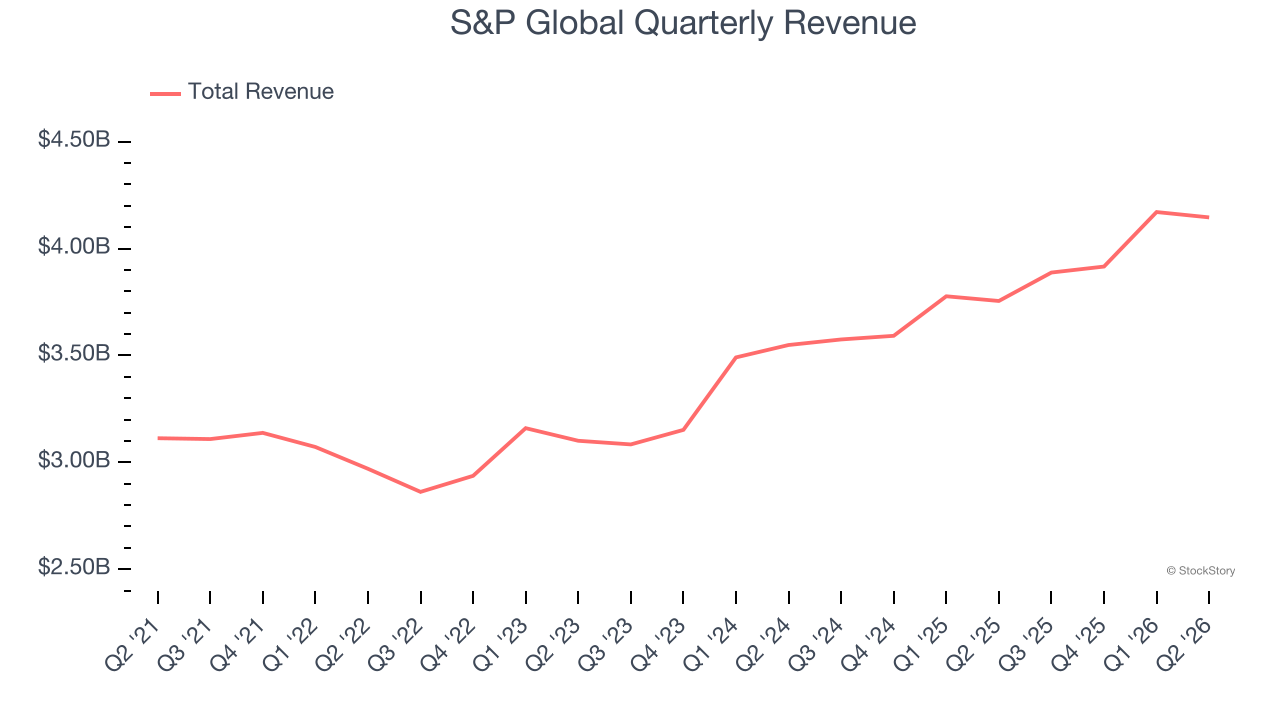
Long-term growth is the most important, but within financials, a half-decade historical view may miss recent interest rate changes and market returns. S&P Global’s annualized revenue growth of 10.2% over the last two years is above its five-year trend, suggesting some bright spots. 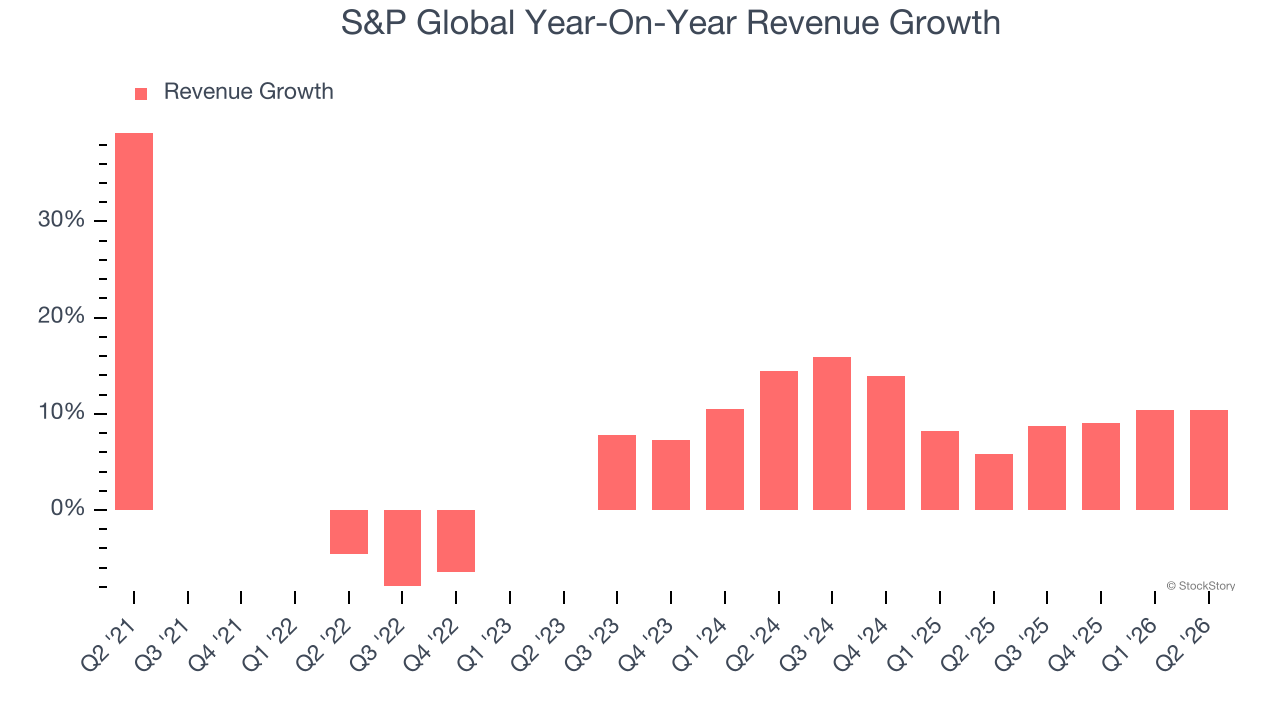 Note: Quarters not shown were determined to be outliers because they were impacted by outsized investment gains/losses that are not indicative of the recurring fundamentals of the business.
This quarter, S&P Global reported year-on-year revenue growth of 10.4%, and its $4.15 billion of revenue exceeded Wall Street’s estimates by 1%.
Key Takeaways from S&P Global’s Q2 Results
S&P Global narrowly exceeded analysts’ revenue expectations for the quarter, but EPS fell short of Wall Street estimates. The company’s full-year EPS guidance also came in below expectations. Overall, this quarter could have been better. The stock traded down 2.7% to $428.04 immediately following the results.
S&P Global’s latest earnings report disappointed. One quarter doesn’t define a company’s quality, so let’s explore whether the stock is a buy at the current price. We think that the latest quarter is only one piece of the longer-term business quality puzzle. Quality, when combined with valuation, can help determine if the stock is a buy. We cover that in our actionable full research report which you can read here (it’s free).