Sales of Existing Single-Family Homes Scrape along Bottom of 4-Year Dumpster, Supply at 11-Year High. Condo Sales at Record Low, Supply at Record High


The affordability crisis has been softening in markets where home prices have fallen for several years and hourly earnings have risen.
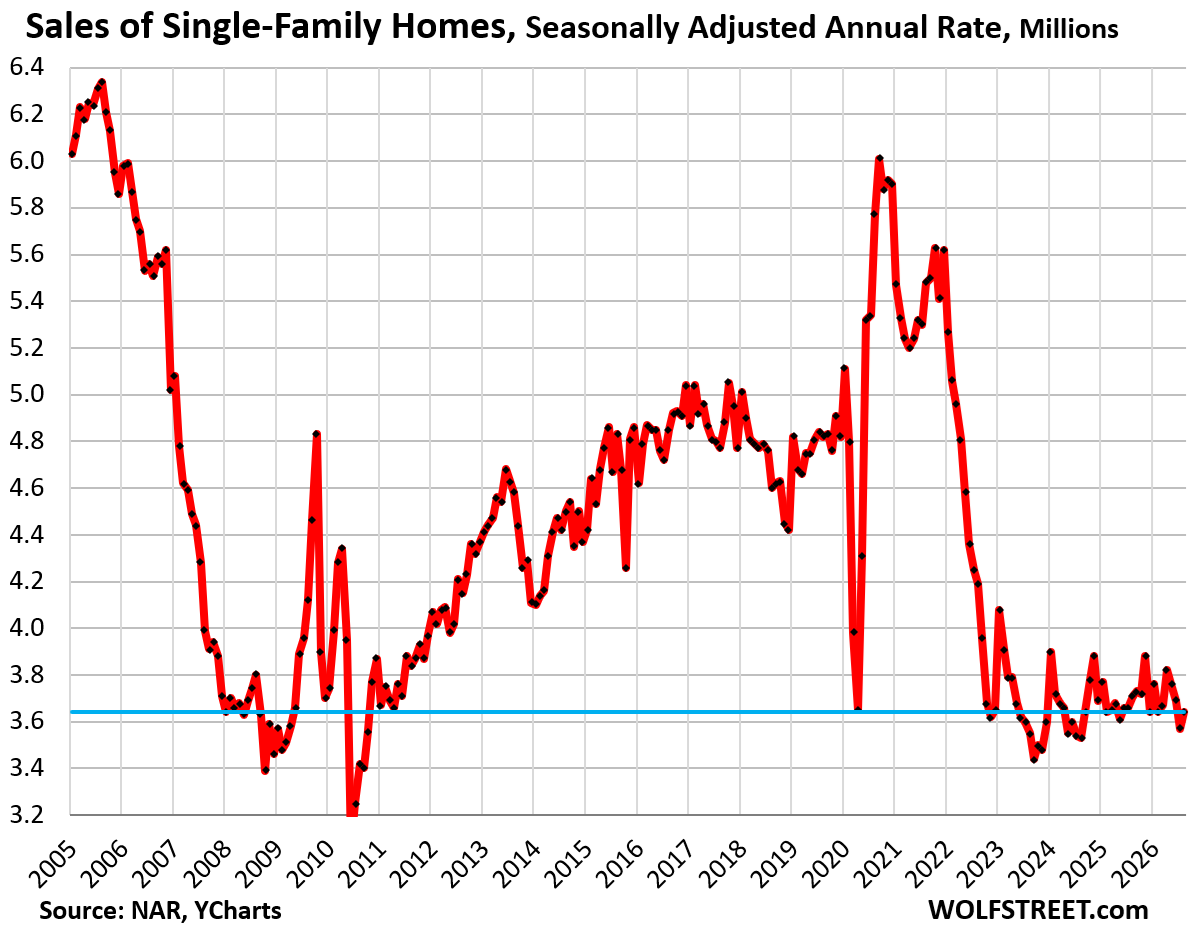
Sales of existing single-family homes in September continued scraping along the very bottom of the four-year dumpster. In September, sales fell by 1.9% from the already beaten-down levels a year ago, the second month in a row of year-over-year declines, to a seasonally adjusted annual rate of 3.64 million sales, according to data by the National Association of Realtors today.
On a month-to-month basis, sales ticked up from the downwardly revised August (revised down the lowest since September 2024).
Sales were down by 24% from September 2019, by 34% from September 2021, by 12% from September 2009 during the Housing Bust, and by 2% from 30 years ago in September 1996.
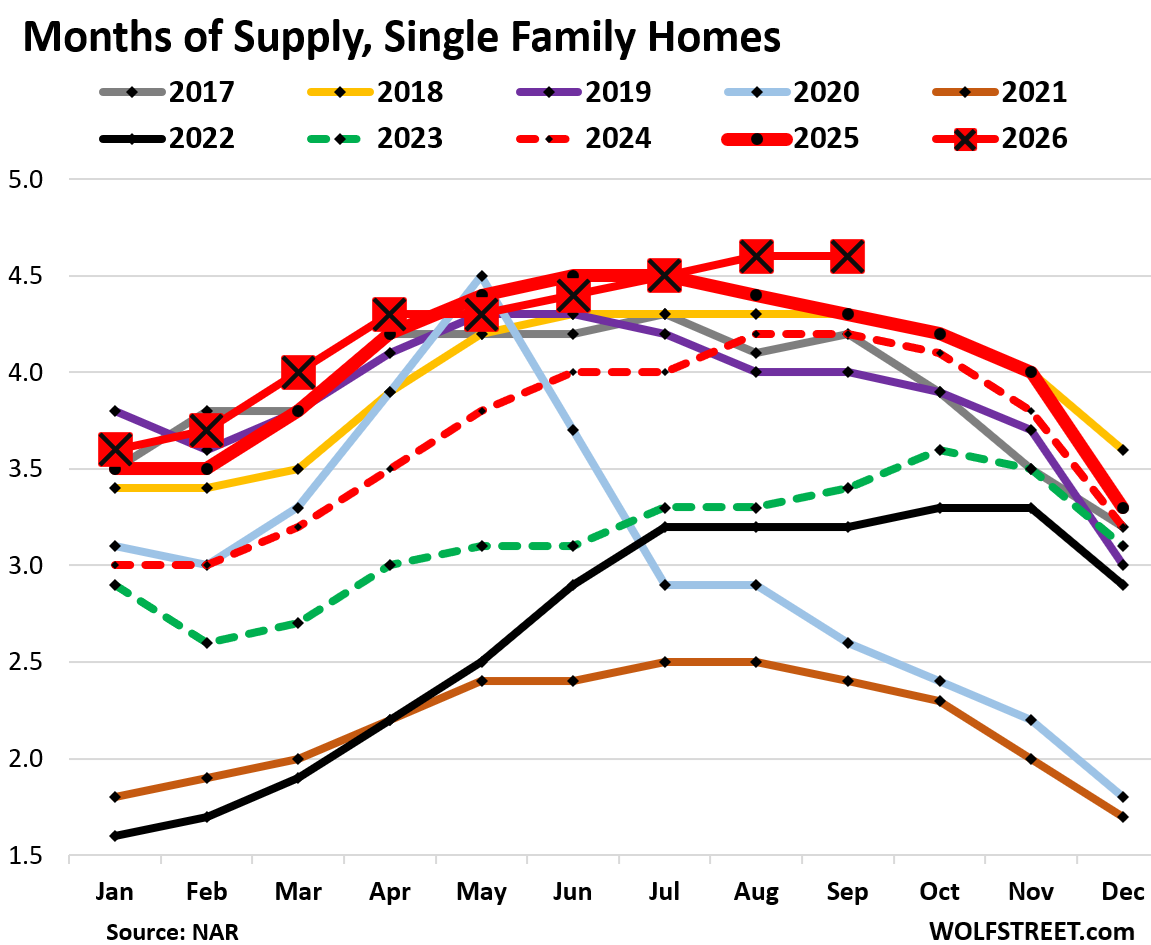
Supply of single-family homes, at 4.6 months in September, was the highest for any September since September 2015 (4.8 months).
Supply is a function of inventory and sales – how much inventory there was at month-end in relationship to sales during the month.
The stacked chart shows 2026 in red with big red squares, 2025 with the fat red line, and 2024 with the dotted red line. Supply has increased year after year, every single year, since the low point in 2021 (2.4 months, brown line at the bottom):
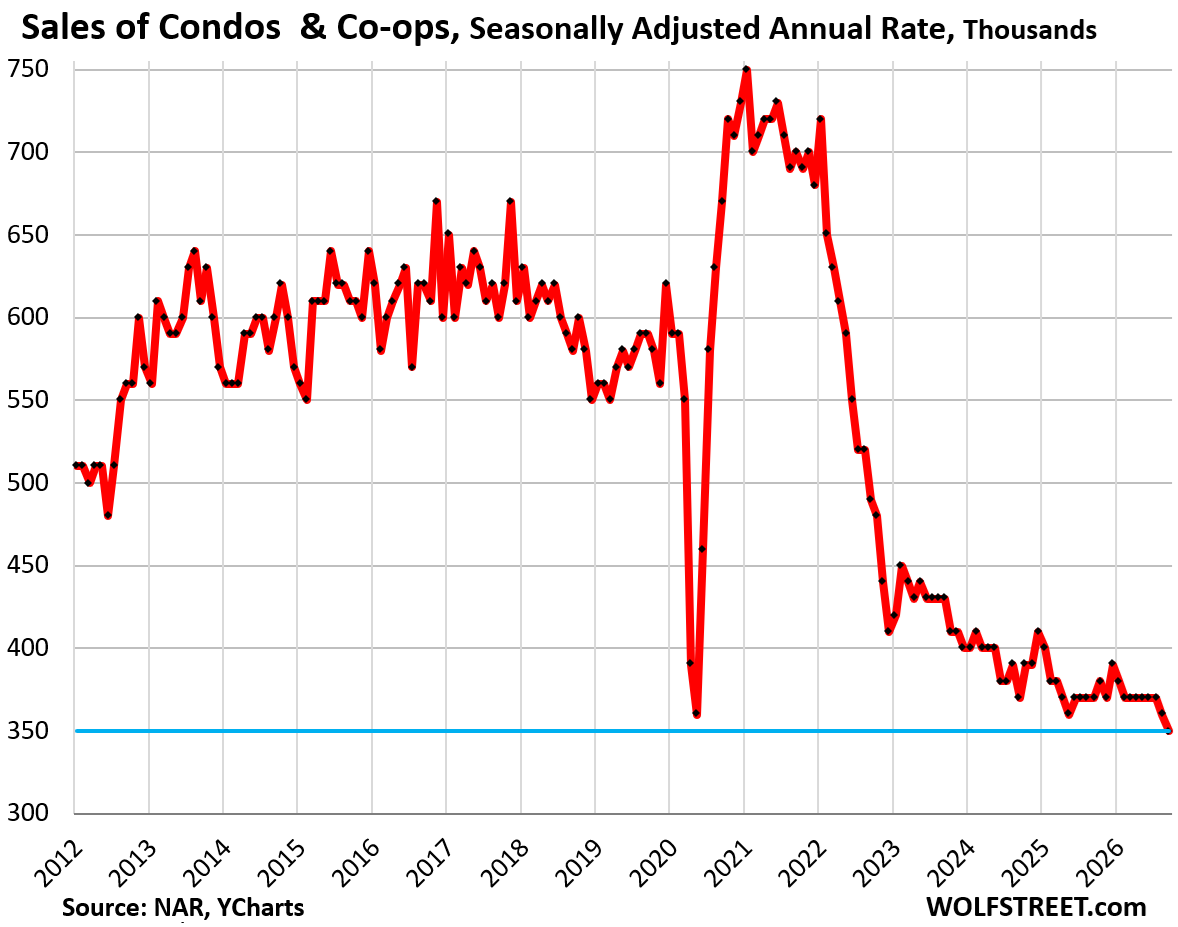
Sales of condos and co-ops fell by 2.8% in September from August, seasonally adjusted, to an annual rate of 350,000, a record low in the data that go back only to late 2011.
Compared to the already collapsed levels a year ago, sales fell by another 5.4%. Compared to September 2019, sales collapsed by 41%. Compared to September 2012, the first September in the data, sales collapsed by 38%.
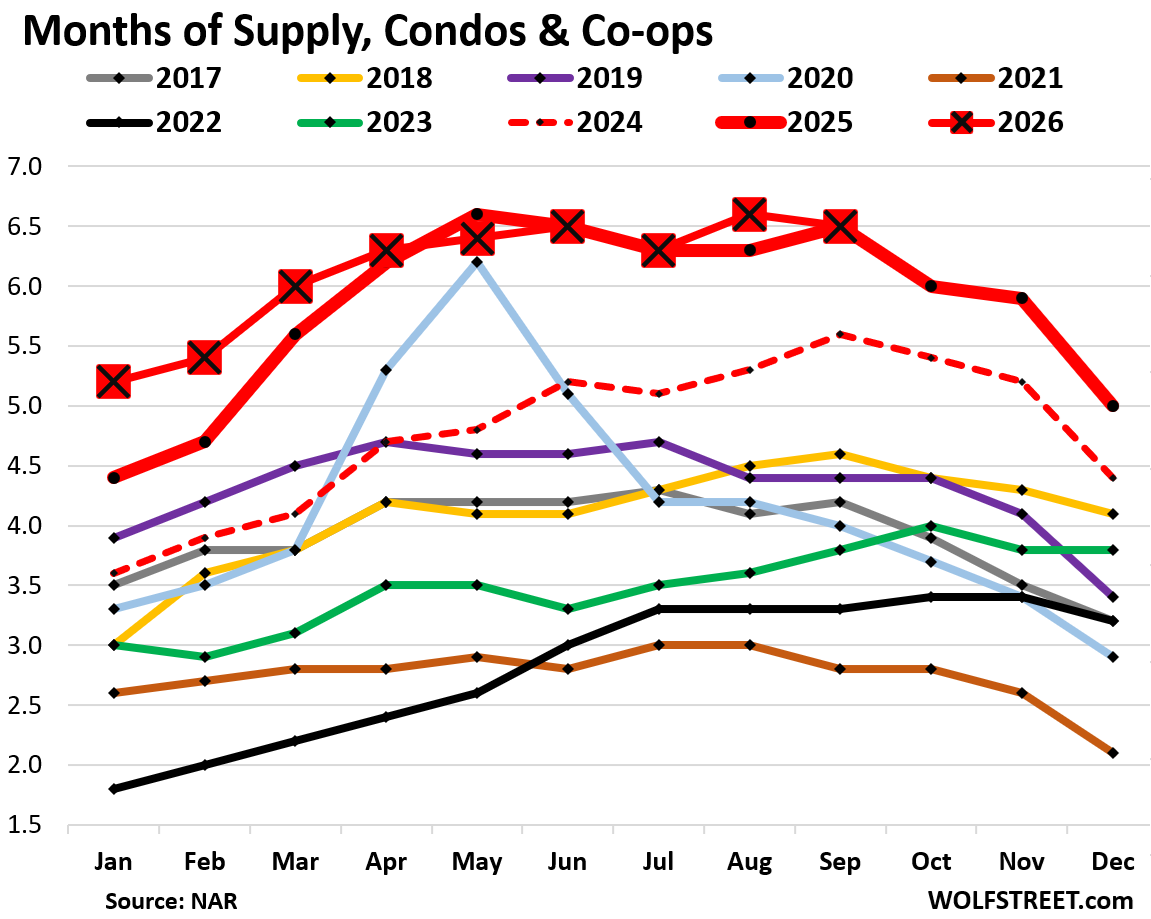
Supply of condos at 6.5 months was the same as September 2025, and both set a record high for September in the NAR’s data that for condos goes back to 2012.
Sales by region.
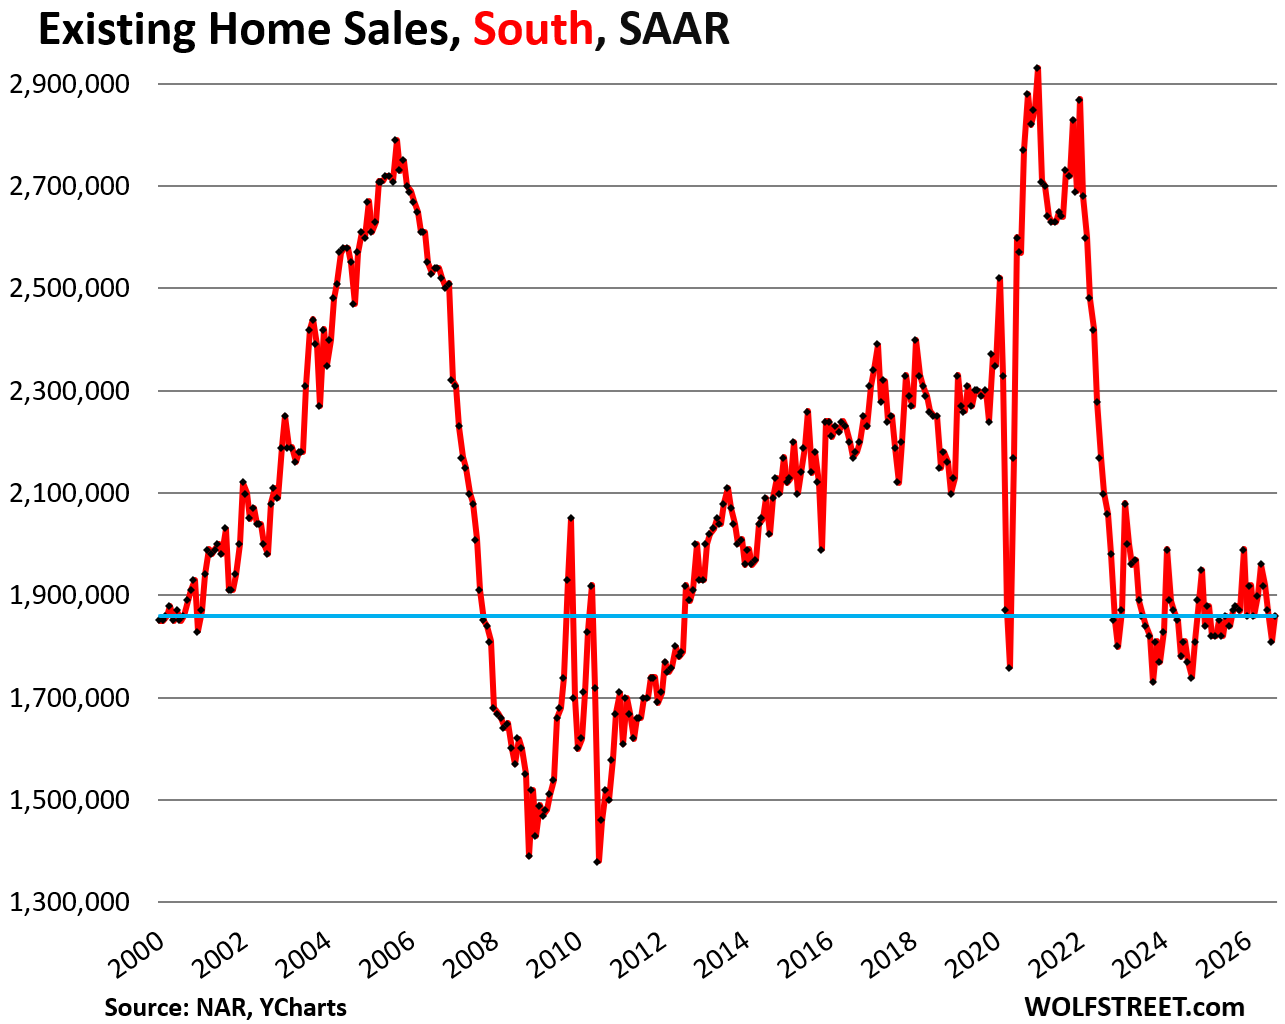
In the South, the seasonally adjusted annual rate of sales ticked up in September from the downwardly revised August sales, to 1,860,000 homes, flipping to a year-over-year decline, after the year-over-year gain in August.
Compared to September in prior years:
- 2025: -0.5% (year-over-year)
- 2024: +6.9%
- 2023: +2.2%
- 2022: -9.7%
- 2019: -18.8%
- 2018: -13.5%
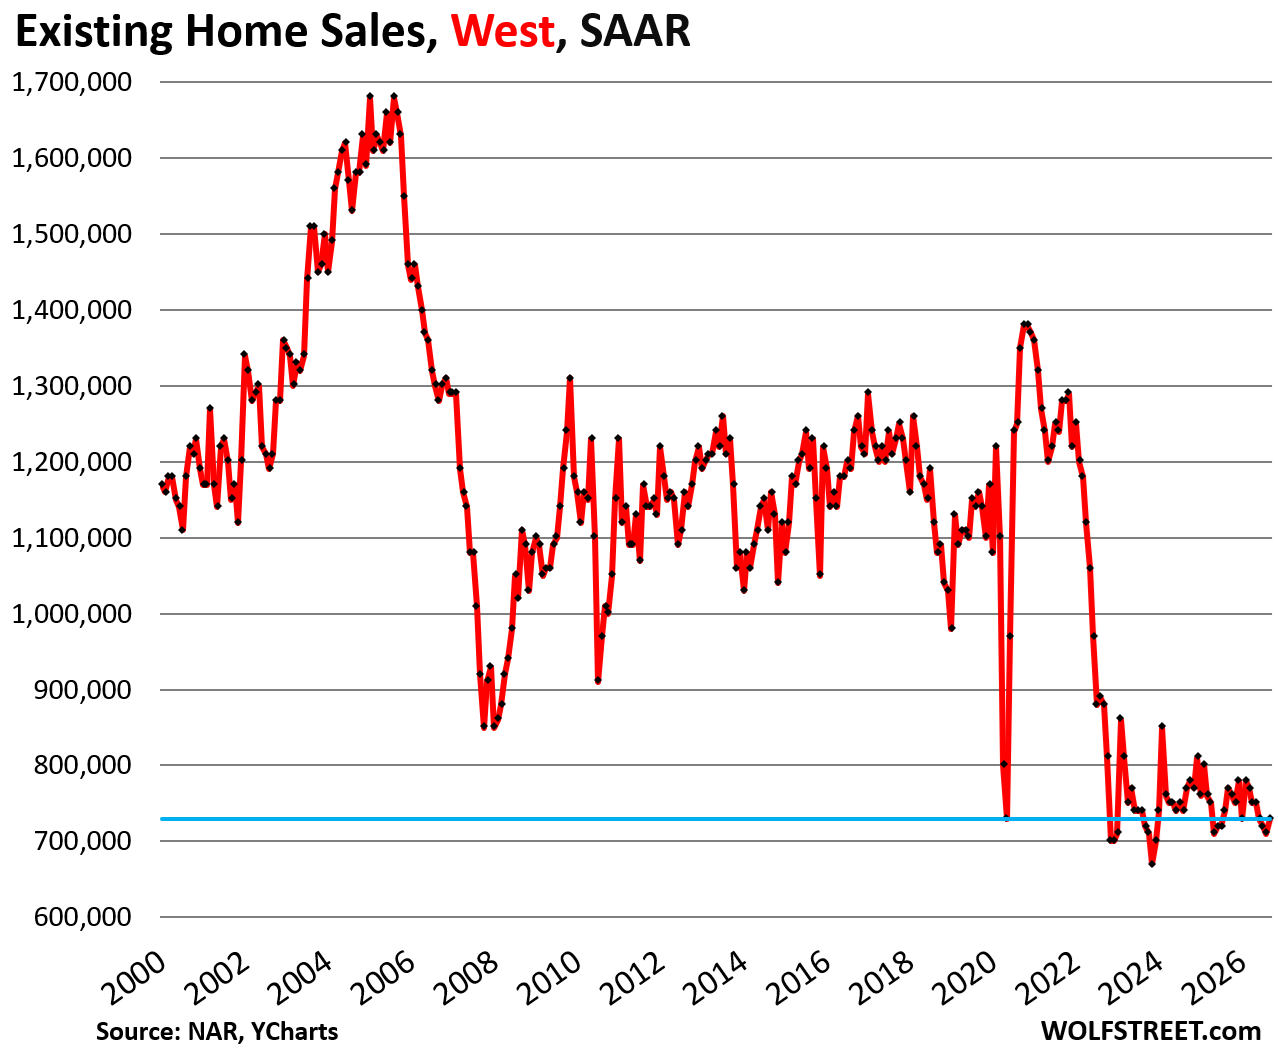
In the West, the seasonally adjusted annual rate of sales ticked up from the downwardly revised sales in August to 730,000 homes. And the year-over-year decline worsened.
Compared to September in prior years:
- 2025: -5.2% (year-over-year)
- 2024: -5.2%
- 2023: +1.4%
- 2022: -17.0%
- 2019: -37.1%
- 2018: -32.4%
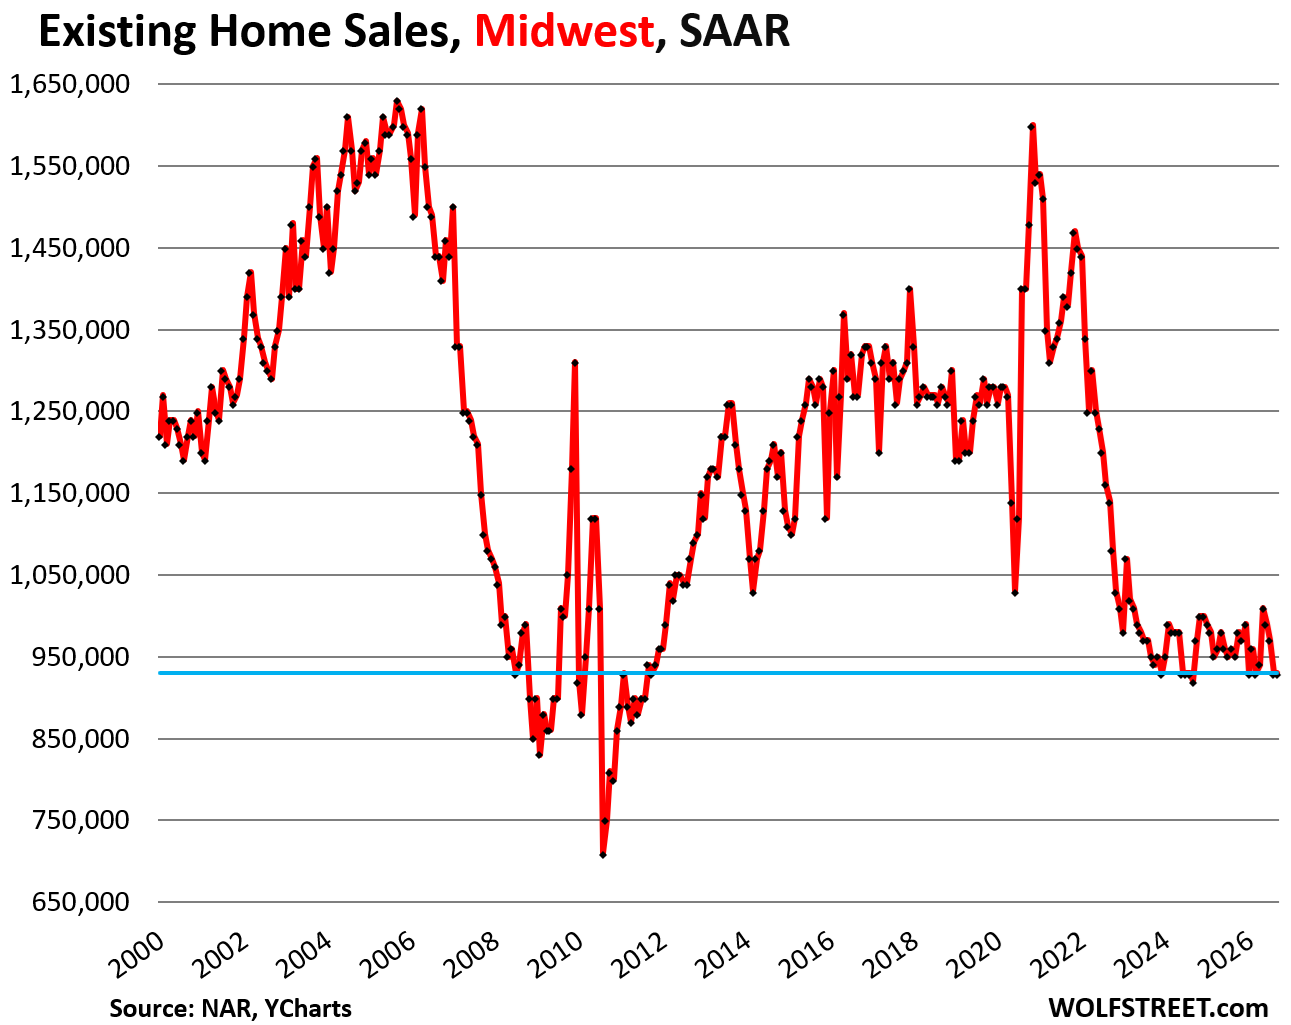
In the Midwest, the seasonally adjusted annual rate of sales was 930,000 homes, same as the downwardly revised level in August. This caused the year-over-year gain in August (+2.1% before downward revision) to flip to a year over year decline in September (-2.1%).
Compared to September in prior years:
- 2025: -2.1% (year-over-year)
- 2024: +1.1%
- 2023: -2.1%
- 2022: -18.4%
- 2019: -27.9%
- 2018: -27.3%
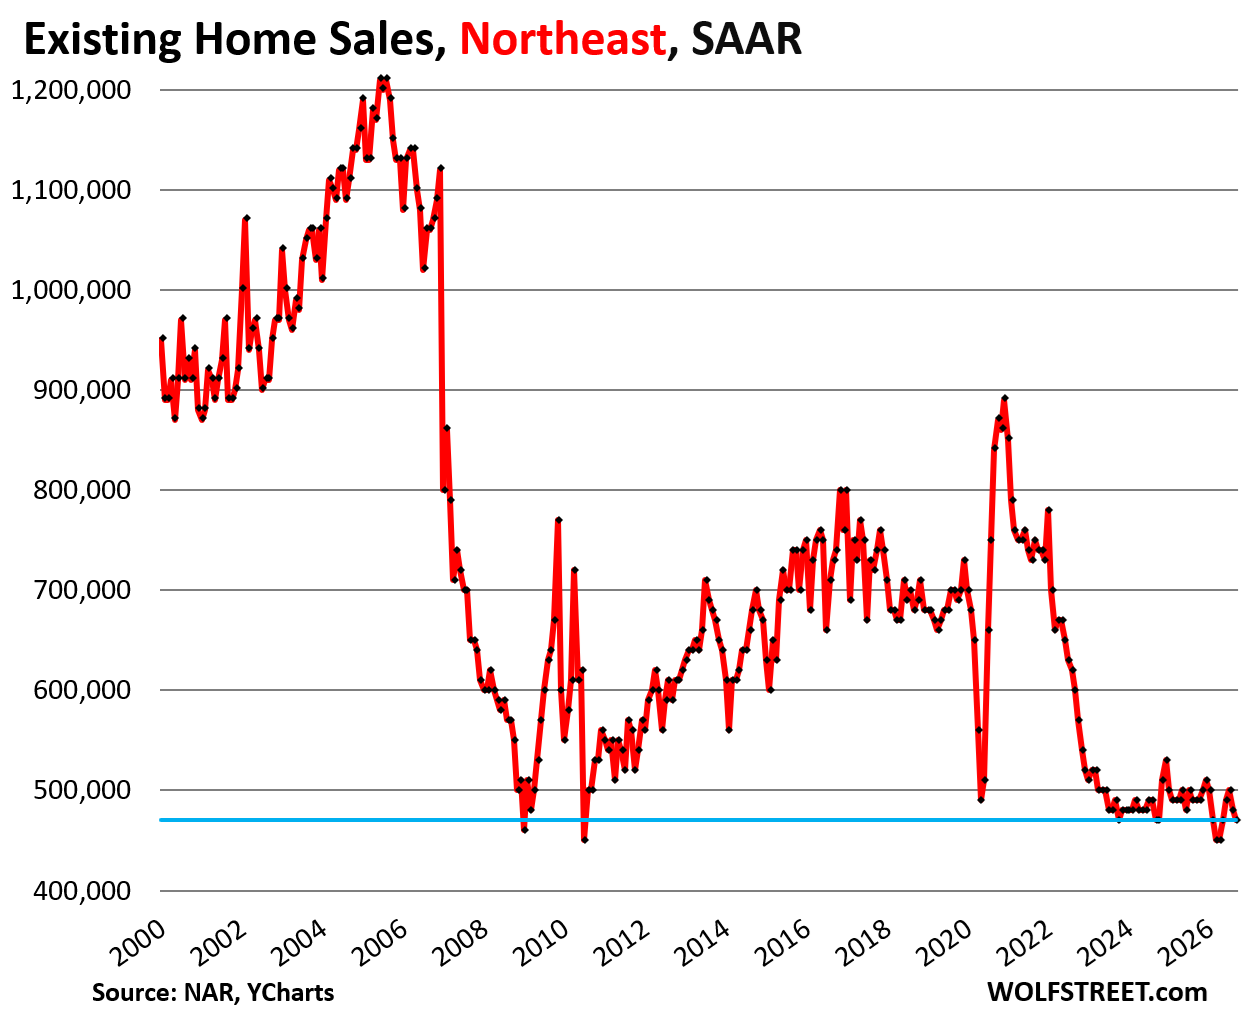
In the Northeast, the seasonally adjusted annual rate of sales fell by 2.1%, to 470,000 homes.
Compared to September in prior years:
- 2025: -4.1% (year-over-year)
- 2024: 0%
- 2023: -4.1%
- 2022: -21.7%
- 2019: -32.9%
- 2018: -30.9%
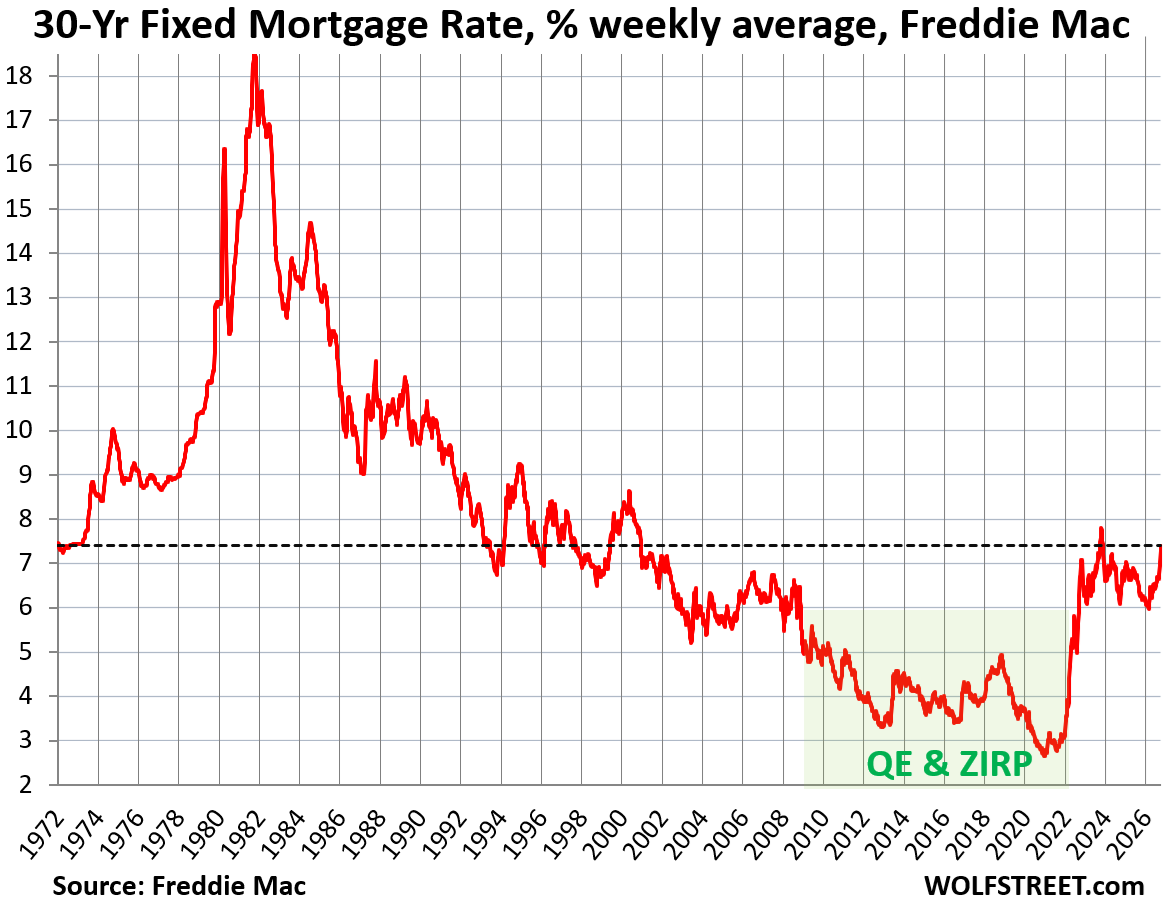
Mortgage rates were higher, but not high historically.
The average 30-year fixed mortgage rate rose to 7.40% last week, according to Freddie Mac’s weekly measure, the highest since the six-week period between early October and mid-November 2023.
In July through late September, when the deals were made that become closed sales by the end of September, mortgage rates were still between 6.4% and 7.0%. The effects of the jump in mortgage rates in October did not impact the closed sales in September, reported today. That is still to come.
In the five-decade historical context, mortgage rates are not high. But home prices are high after the price explosion between mid-2020 and mid-2022. That’s the culprit in the affordability crisis. And inflation is high.
Mortgage rates track long-term Treasury yields, but are higher, and the spread between them varies over time.
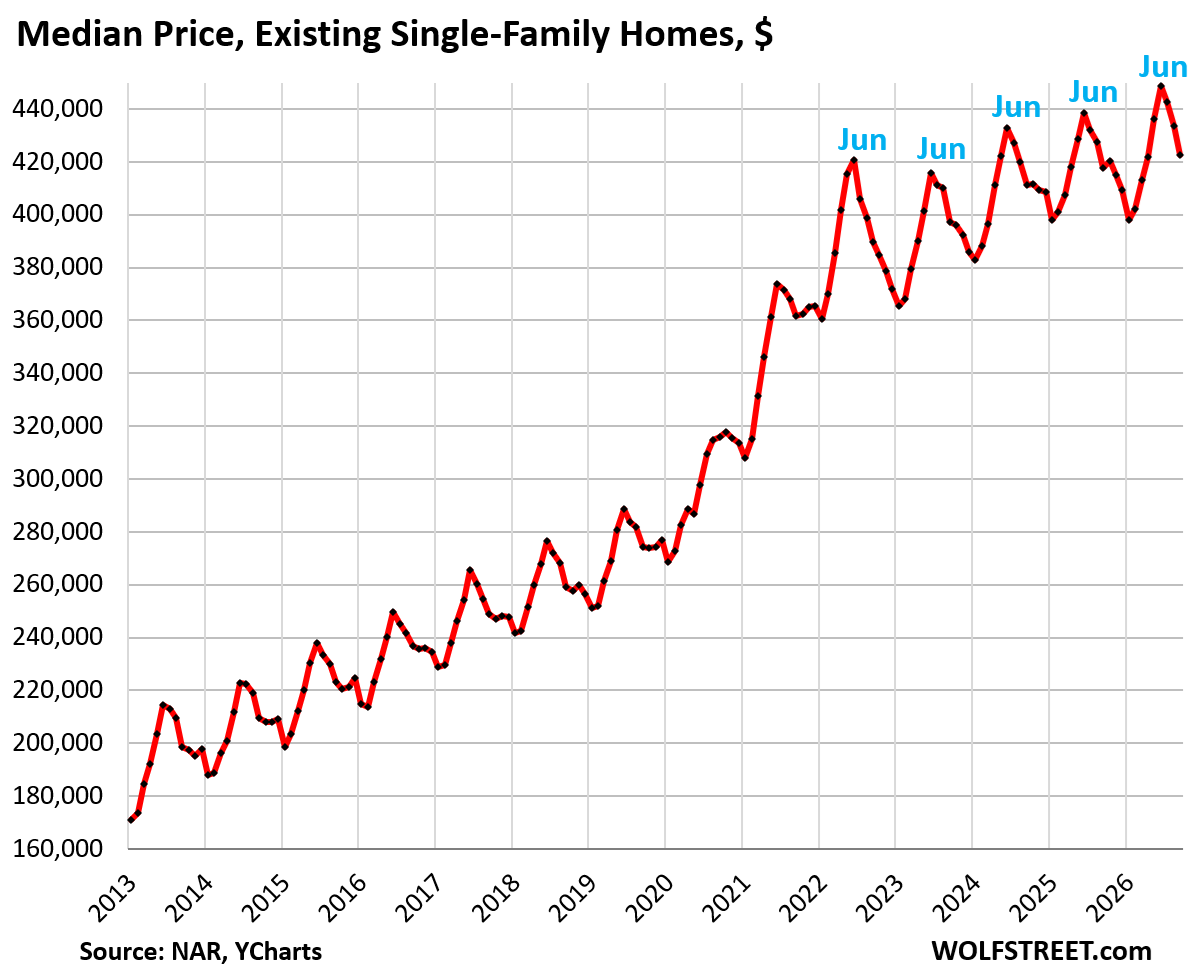
The national median price of single-family homes declined along seasonal patterns to $422,700 in September, not seasonally adjusted. Year-over-year, it was up by 1.2%.
The “affordability crisis” at the national level was caused by the 40% explosion of the national median price in the two years through mid-2022 that had come on top of already high prices.
Wage increases reduce the affordability crisis. Since September 2022, over those four years, average hourly earnings have increased substantially faster than the national median price of single-family homes, thereby easing very slowly, over many years, the affordability crisis.
Over the four years since September 2020:
- National median price of single-family homes: +8.5%
- Average hourly earnings: +16.1%
- Consumer Price Index (CPI): +12.7% (through August).
Local prices differ dramatically.
For people buying or selling a home, the national median price is irrelevant. What matters are prices in their local markets.
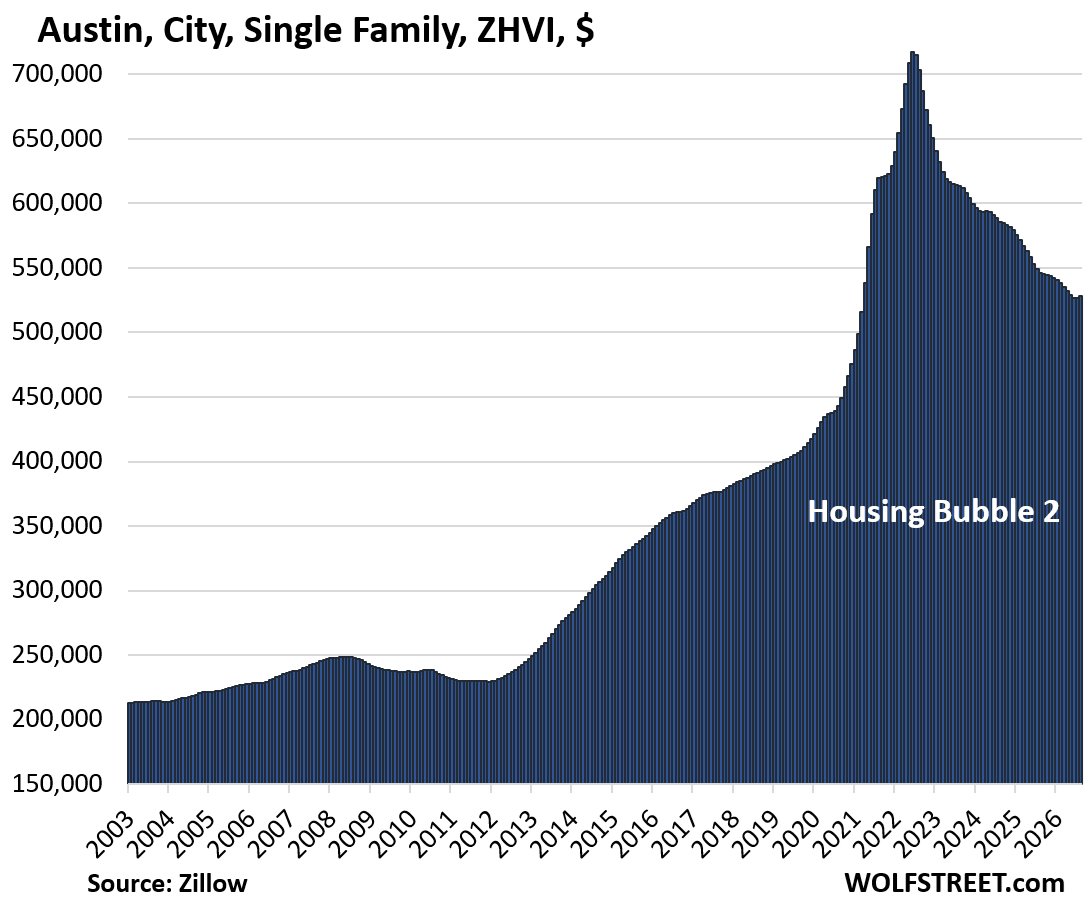
In some of those markets, the affordability crisis has softened by quite a bit through the combination of rising wages and sharply falling home prices, for example:
Prices of single-family homes in the cities of:
- Austin, TX: -26%
- Oakland, CA: -23%
- Cape Coral, FL: -22%
- New Orleans, LA: -20%
But in some other cities, prices of single-family homes have continued to rise to new highs and worsened the affordability crisis.
The biggest cities with new highs and the biggest year-over-year gains:
- Toledo: +6.0%
- Chicago: +5.6%
- Rochester: +4.6%
- New York City: +4.4%.
The national median price of condos and co-ops declined along seasonal lines to $363,000 in September. Year-over-year, it was up by 1.2%.
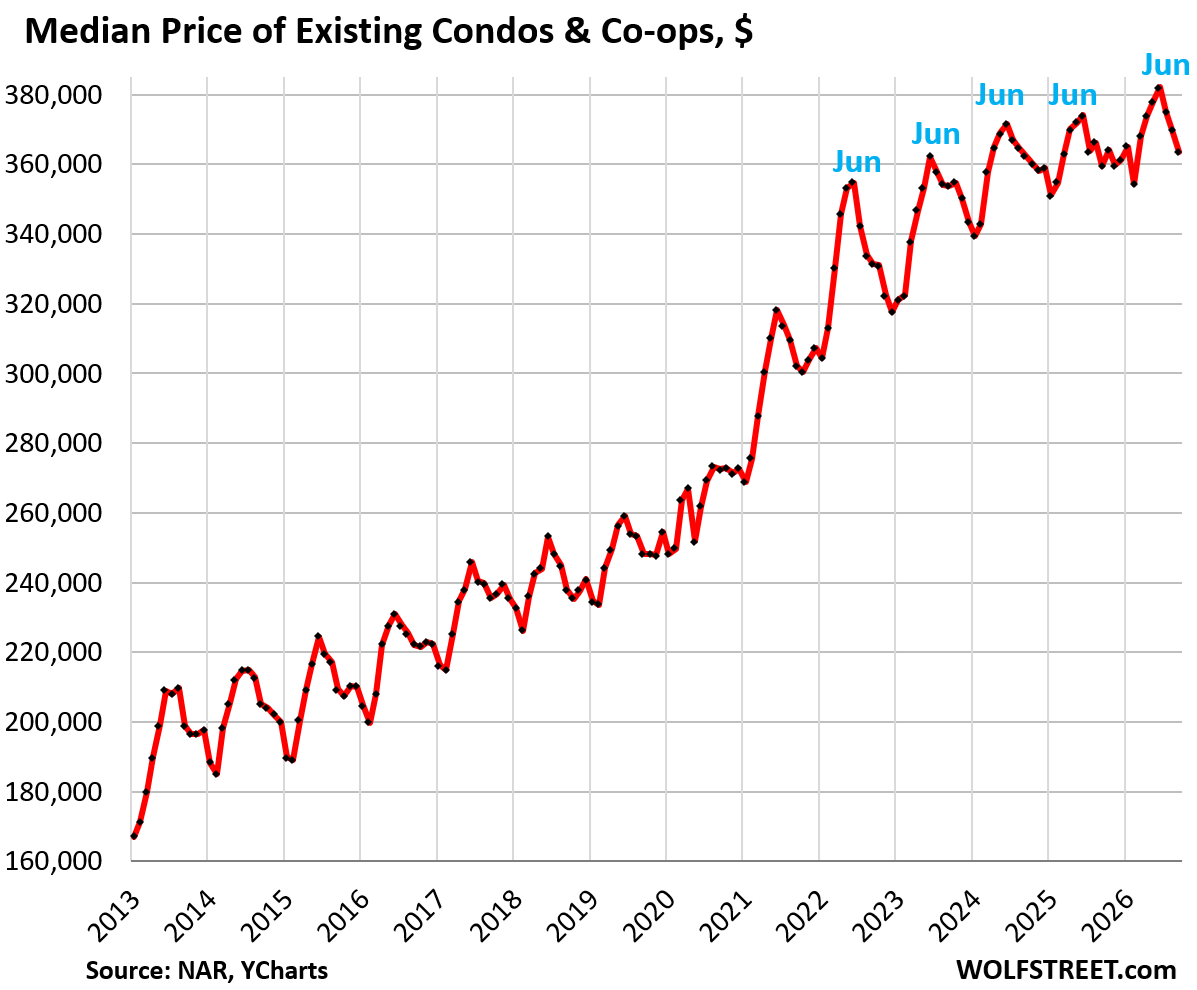
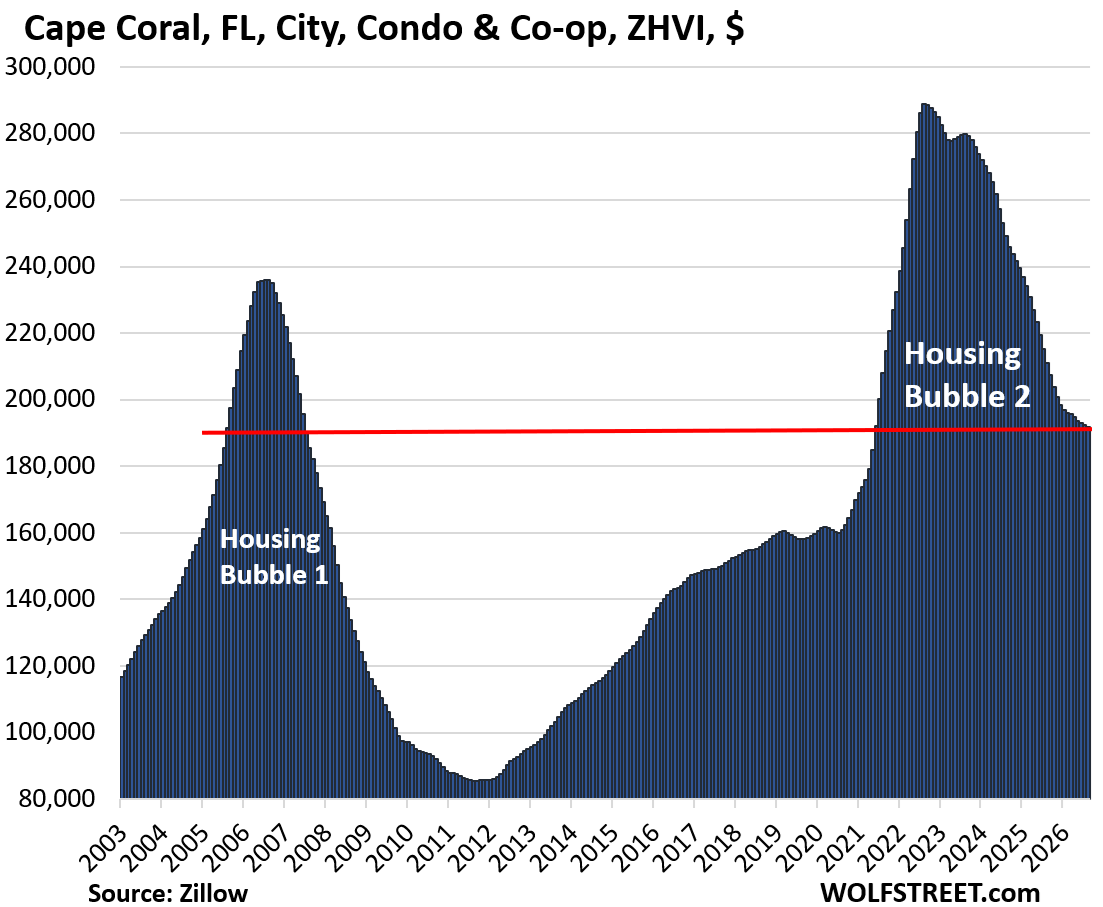
But condo prices have plunged in many cities, and the affordability crisis has softened substantially in those cities. In some of those cities, condo prices have fallen below their highs in 2006 (see our report: Oh Dear, Condo Prices Dropped by 15% to 34% in 34 Bigger Markets).
- Cape Coral, FL: -34%
- Oakland, CA: -32%
- Petersburg, Fl: -30%
- Austin, TX: -28%
- Fort Myers, FL: -27%
- Sarasota County, FL: -24%
- Garland, TX: -22%
- Tampa, FL: -22%.
The national median condo price is irrelevant for condo buyers and sellers anywhere.