Economy Is Running Hot on Strong Consumer Spending Growth & Massive AI Investment Boom


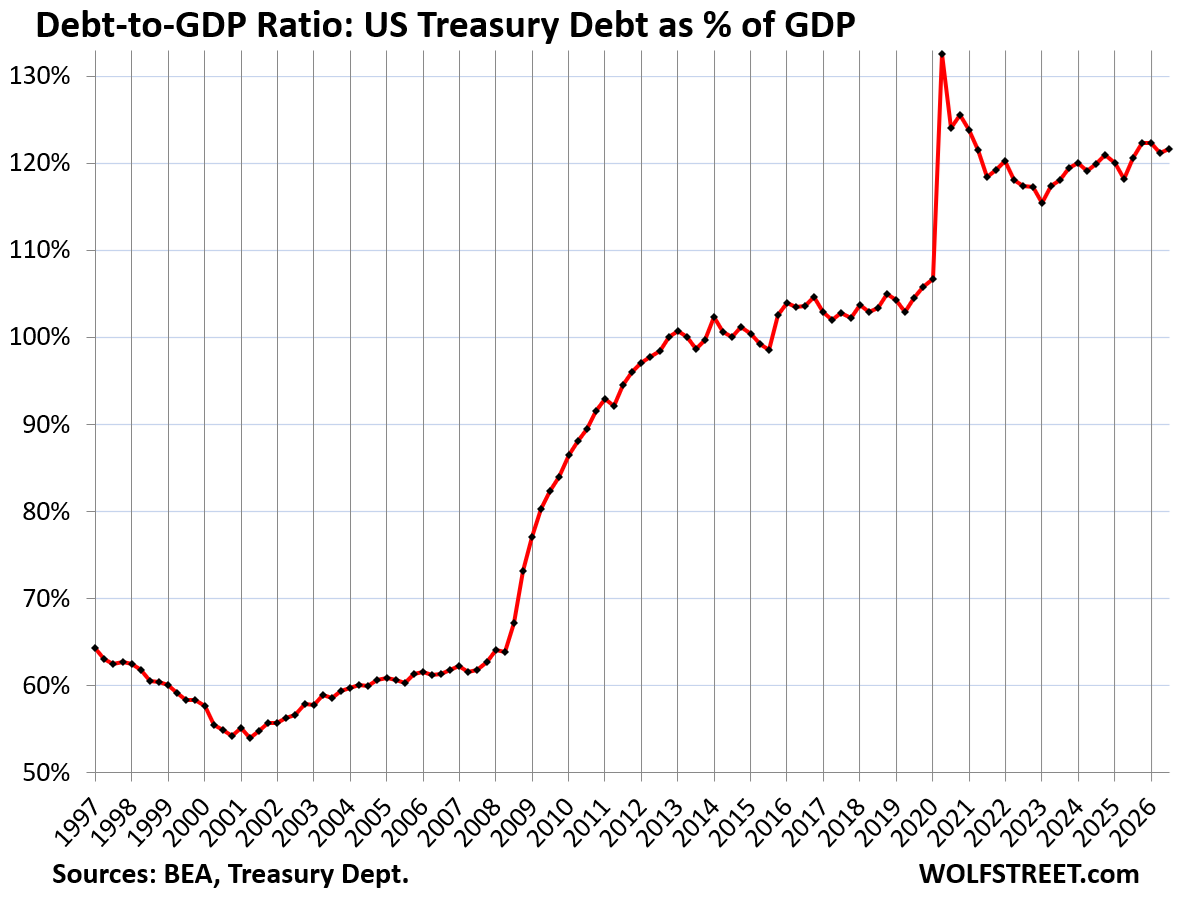
But the trade deficit worsened, driven by the AI boom. And the drunken sailors in Washington pushed the Debt-to-GDP ratio to 121.7%.
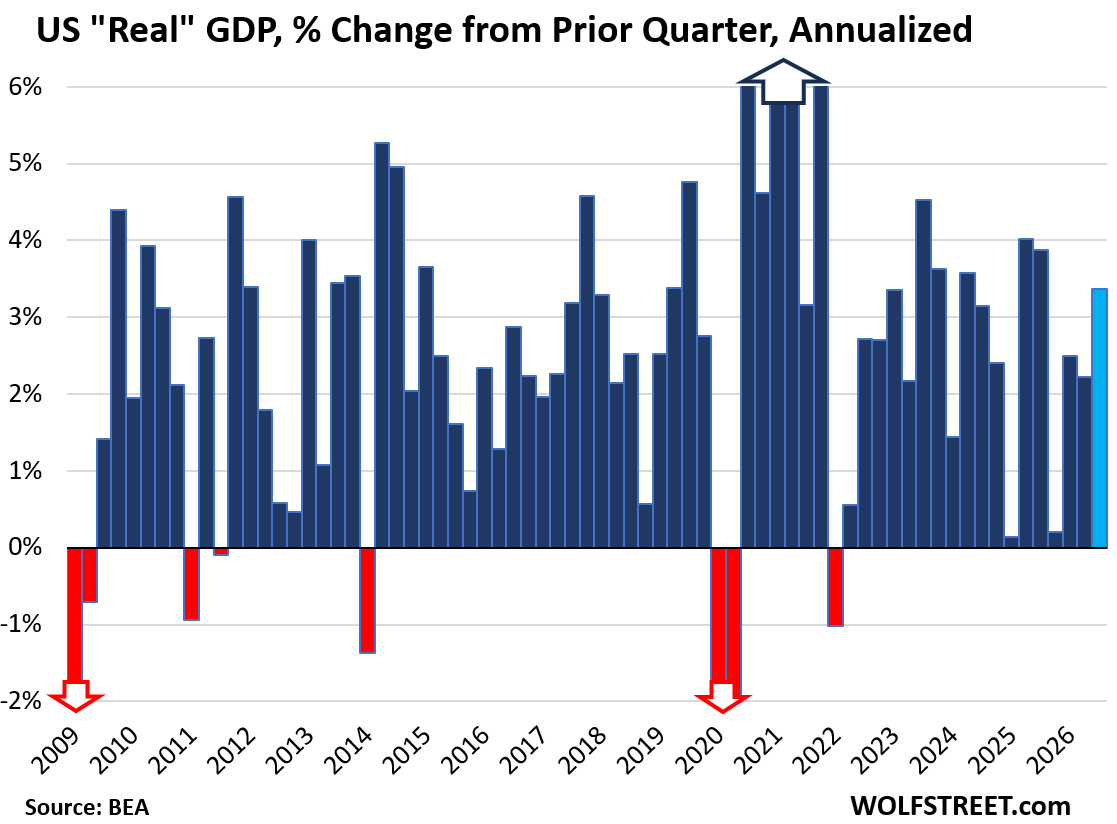
The overall economy, adjusted for inflation, grew by a strong 3.4% in Q3 annualized, according to the Bureau of Economic Analysis today. A purer measure of the domestic private portion of the overall economy, also released by the BEA today, was red hot.
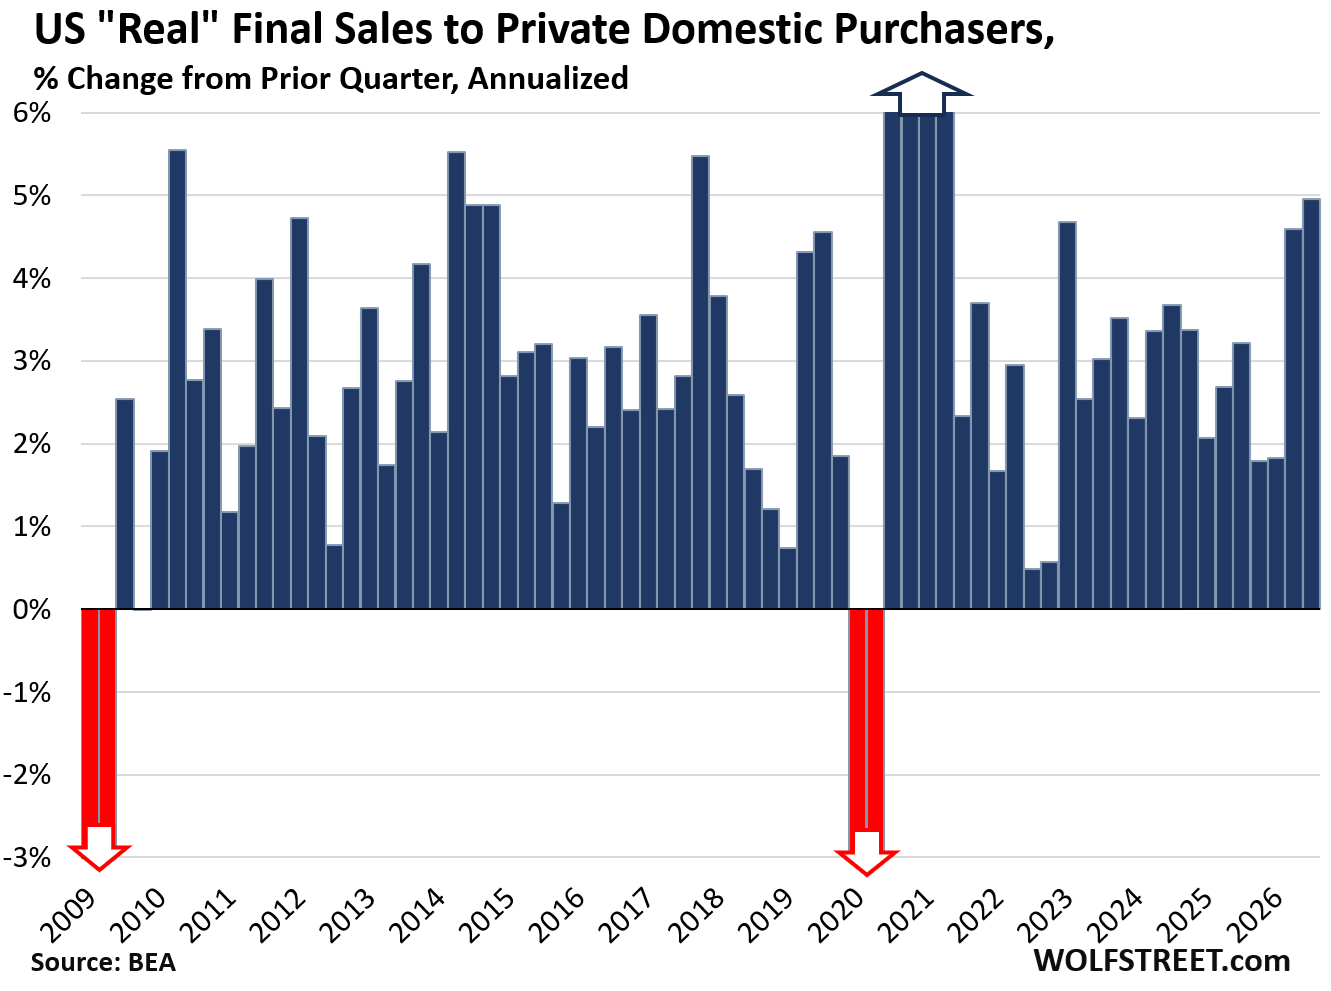
The private economy is red hot. The “Real Final Sales to Private Domestic Purchasers” excludes government spending, imports and exports, and the change in inventories. It reflects private-sector domestic demand and covers 88% of overall GDP.
This Real Final Sales to Private Domestic Purchases soared by 4.9% in Q3 annualized, adjusted for inflation, the fastest growth since the reopening of the economy in Q2 2021, after the already very strong growth rate in Q2 (+4.6%), according to the BEA today. So for a moment, forget the jump in government spending, forget imports and exports, forget the confusing inventory adjustment. This is the private US economy, and it’s hot.
“Real” GDP overall grew by 3.4%, adjusted for inflation, dragged down by a massive spike in imports (deducted from GDP) due to high-dollar AI data-center related equipment. The trade deficit knocked 3.32 percentage points off GDP growth.
In the years between the Great Recession and the pandemic (so excluding recessions), average quarter-to-quarter GDP growth was 2.5% annual rate. The average 20-year quarter-to-quarter GDP growth, including recessions, was 2.2% annual rate. So Q3 growth of 3.4% was far above average, despite the huge trade deficit.
How much each major component of GDP contributed to or subtracted from this 3.4% GDP growth, in percentage points:
- Consumer spending: +2.52
- Gross domestic private investment: +3.27
- Net Exports (trade deficit): -3.32
- Federal Government: +0.91
- State & Local governments: -0.1
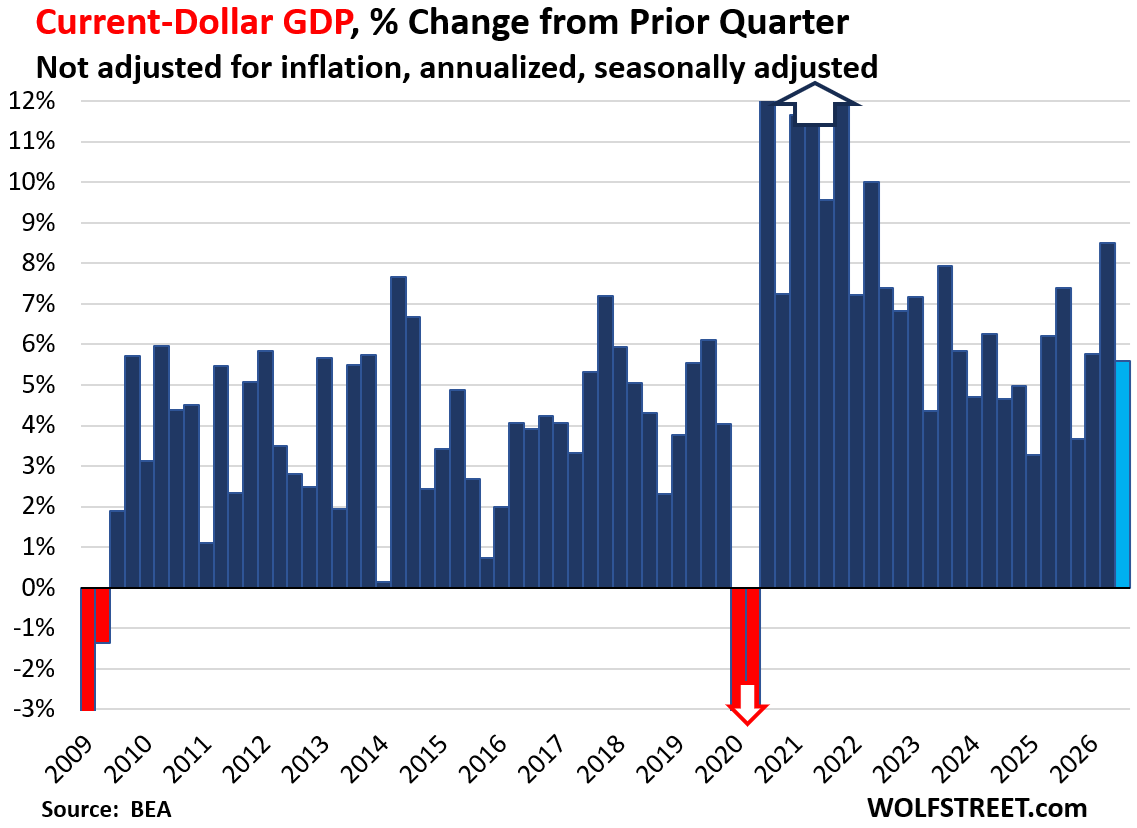
“Current-dollar GDP” (not adjusted for inflation) grew by 5.6% to $33.0 trillion in “current dollars,” all annual rates.
This “nominal GDP” of $33.0 trillion represents the actual size of the US economy in today’s dollars and forms the basis for the Debt-to-GDP ratio (more in a moment) and similar GDP-based ratios.
The difference between this growth rate of 5.6% in current dollars, and the growth rate of “real” GDP of 3.4% was the rate of inflation in the overall economy in Q3 of 2.2%, the so-called GDP deflator. Average energy prices in Q3 dropped off from the horrendous spike in Q2, which helped reduce the GDP deflator in Q3.
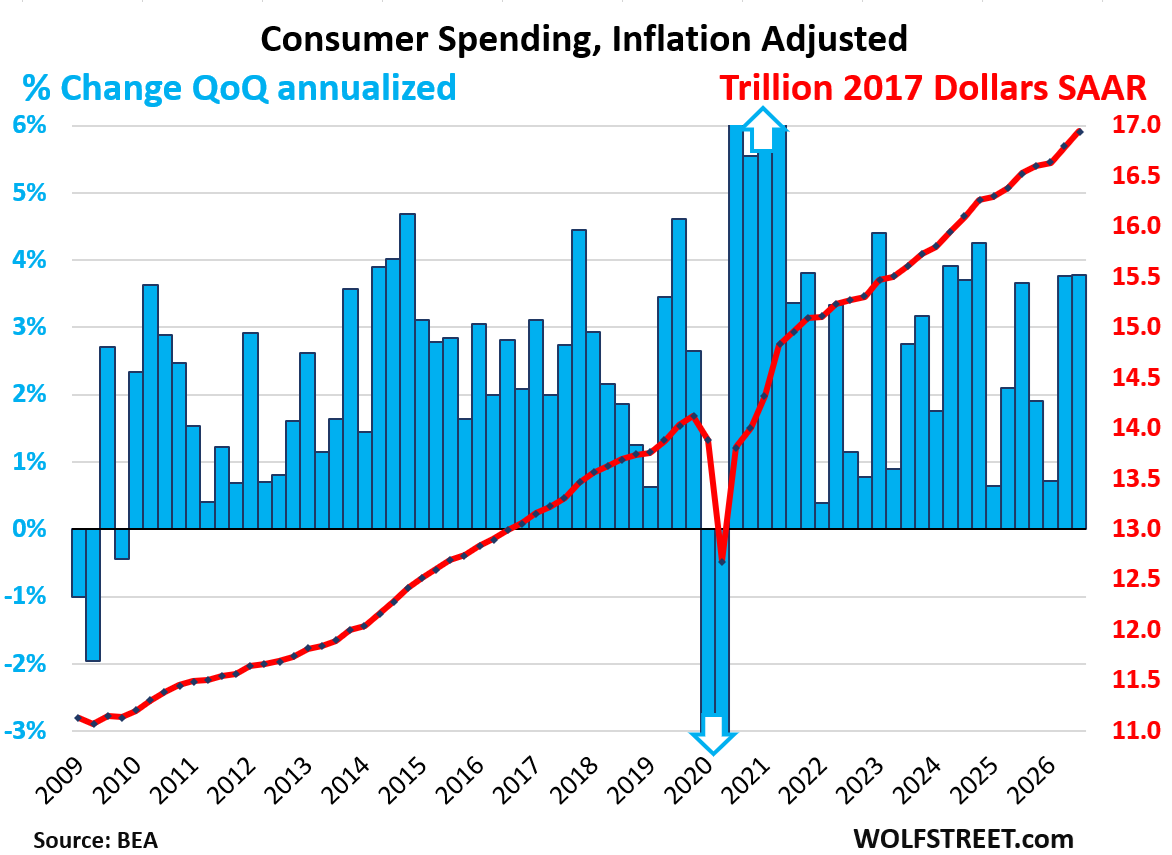
Consumer spending jumped by an annual rate of 3.8% in Q3, adjusted for inflation, after having already jumped by 3.8% in Q2. That’s two quarters back-to-back of very strong consumer spending growth. Consumer spending accounted for 69% of the US economy.
This growth rate added 2.5 percentage points to the GDP growth of 3.4%.
The spending growth was spread over goods and services. All are adjusted for price changes (inflation):
- Services: +4.1%.
- Durable goods: +2.3%
- Nondurable goods: +3.4%.
The blue columns show the growth rates (left axis), the red line shows the dollars (right axis), all in seasonally adjusted annual rates (SAAR):
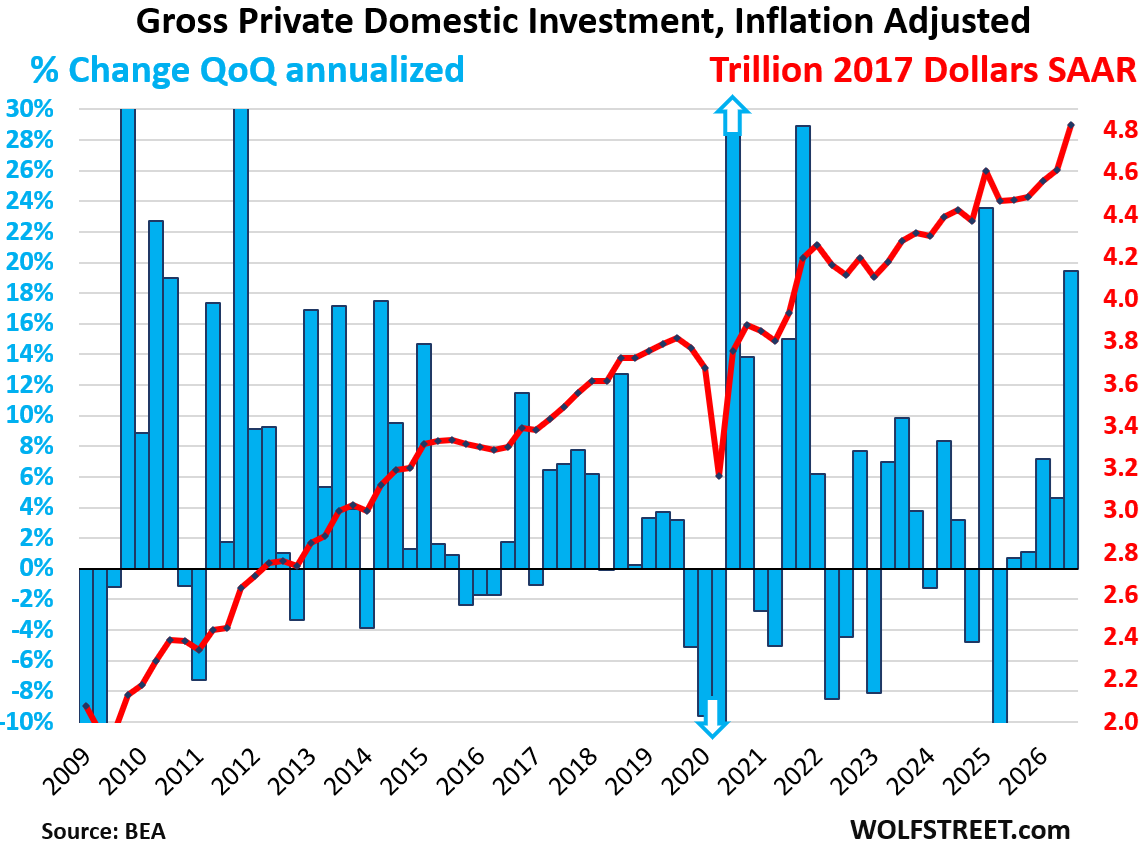
Gross private domestic investment (which includes change in private inventory inventory) spiked by 19.4% in Q3 annualized, to $4.8 trillion, adjusted for inflation.
This added 3.7 percentage points to the 3.4% GDP growth. This 19.4% spike was huge.
But part of it were purchases of AI related equipment, some of which ended up as inventory in warehouses, so the “change in private inventories” was huge and it’s included in gross private fixed investment here. That change in private inventory added 1.61 percentage points to the 3.4% GDP growth, as part of the 3.7 percentage points that gross private fixed investments added.
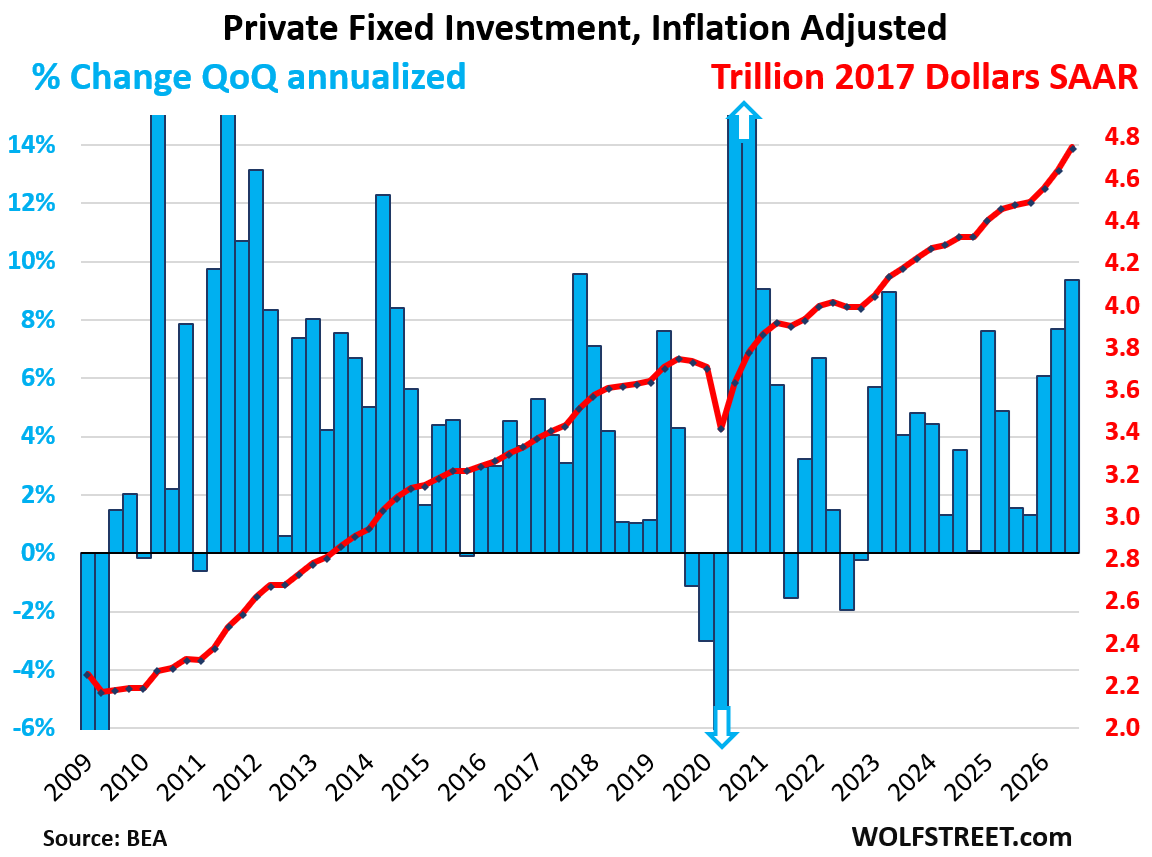
Private fixed investment, which excludes the confusing change in inventories, spiked by 9.4% in Q3 annualized, adjusted for inflation, after having already jumped by 7.7% in Q2 and by 6.1% in Q1.
It added 1.66 percentage points to 3.4% GDP growth.
This boom was driven at least in part by the AI investment boom.
But the component of “residential fixed investment” dropped in Q3, as the housing market faces a glut of new single-family and multifamily homes, and homebuilders and multifamily developers are applying some prudence to this housing glut (see my analysis: What the “Housing Shortage” of New Single-Family Homes Looks Like: Ballooning Inventories, Falling Prices, So-So Sales):
- Nonresidential fixed investments: +12.7%; that’s where the AI investment boom shows up.
- Structures: +5.4%
- Equipment: +20.9%, driven by AI equipment
- Intellectual property products (software, movies, etc.): +8.4%.
- Residential fixed investment: -3.3%, driven by homebuilders and multifamily developers being prudent as they face a housing glut.
Private fixed investment accounted for 19% of the US economy.
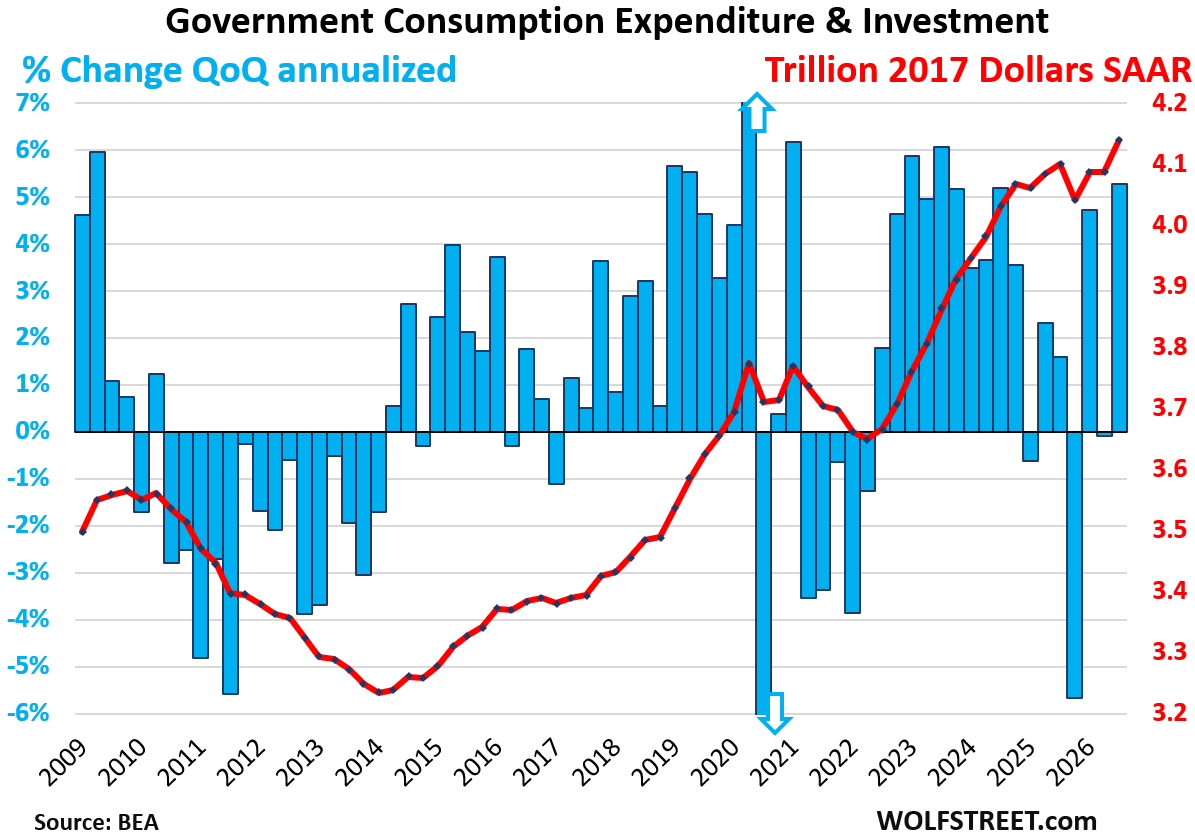
Government consumption expenditures and gross investment spiked by 5.3% annualized, adjusted for inflation, after declining in Q2.
Note: This measure, “government consumption expenditures and gross investment,” does not include interest payments as interest payments are generally not included in GDP. And it does not include transfer payments made directly to consumers (the biggest part of which are Social Security payments), which are counted in GDP when consumers and businesses spend these funds or invest them in fixed investments.
Federal government spending spiked by 15.8% annualized in Q3, after the drop in Q2:
- National defense: +11.7%
- Nondefense: +22.2% after the -12.7% plunged in Q2
Federal government spending added 0.91 percentage points to 3.4% GDP growth.
State and local government spending declined by 0.1%, which subtracted 0.1 percentage points from GDP growth.
Combined, federal, state, and local government consumption and investment accounted for 20% of the US economy. About 60% of this measure of government spending is from state and local governments. Federal government spending accounts for about 40%.
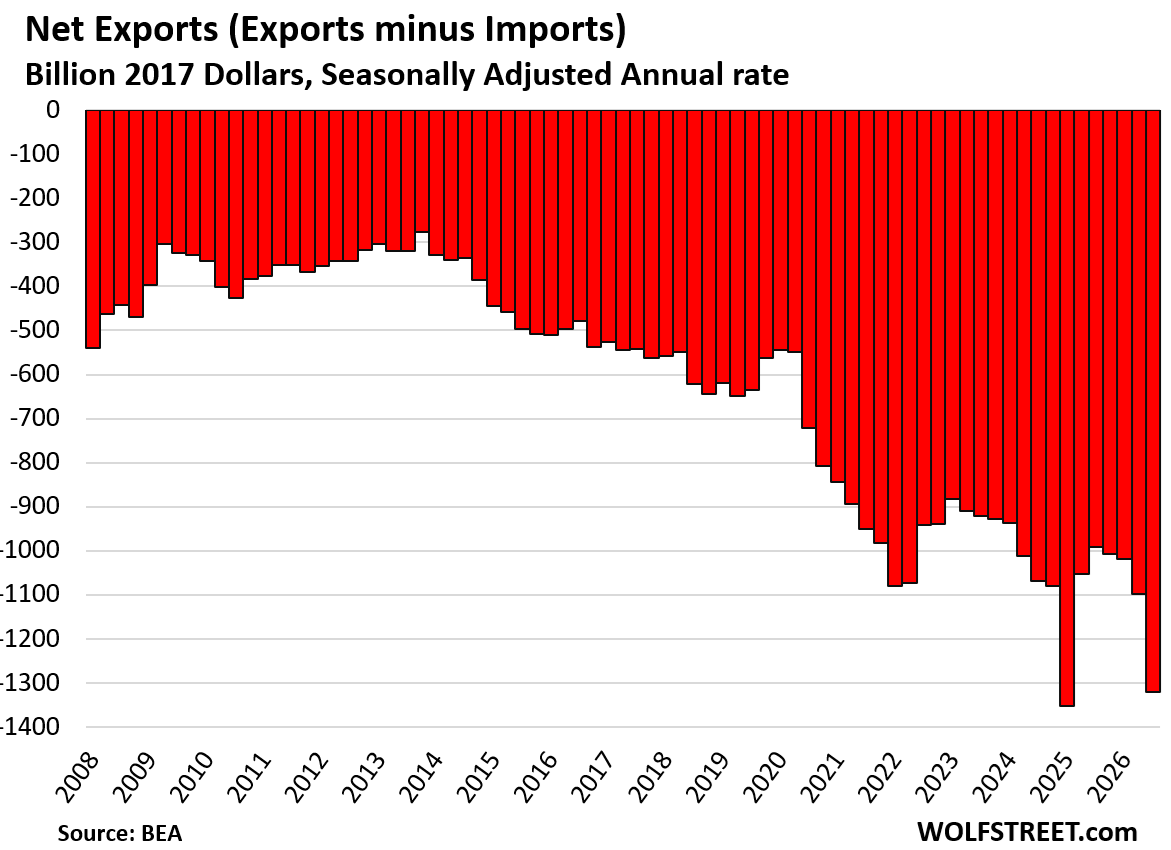
Trade Deficit worsens on spiking imports of AI equipment.
“Net exports” (exports minus imports) worsened dramatically to an inflation-adjusted trade deficit of $1.32 trillion.
Net exports subtracted 3.32 percentage points from 3.4% GDP growth.
Imports spiked by 19.7% in Q3 annualized, adjusted for price changes, on spiking imports of high-dollar electronic products, including semiconductors to be used in AI data centers.
Imports are a negative in GDP, and this spike in imports deducted 2.64 percentage points from the 3.4% GDP growth.
- Imports of goods: +26.4%, a massive spike!
- Imports of services: -4.2% (includes US tourists spending overseas).
Exports plunged by 5.7%, after jumping in the prior two quarters. Exports are a positive in GDP. But the plunge (negative figure) subtracted 0.68 per percentage points from the 3.4% GDP growth.
- Exports of goods: -0.57%.
- Exports of services: -0.1% (includes foreign tourists spending in the US).
The Government’s Treasury Debt-to-GDP ratio ticked up to 121.7%, as current-dollar GDP rose 1.37% quarter-to-quarter not annualized to $33.0 trillion (see above), while the Treasury debt spiked by 1.8% quarter-to-quarter to $40.2 trillion.
So in Q3, the economy grew more slowly than the debt, and the Debt-to-GDP Ratio worsened, more than wiping out the improvement in Q2, but it’s lower year-over-year (down from 122.4% in Q3 2025).
This is a sobering situation that the drunken sailors in Congress, who have created it, refuse to even acknowledge. They’re already talking about tax cuts again! These people are addicted to buying votes with promises until the bond market shoves them against the wall and grinds their faces into it, and then they might consider dealing with it, the sooner the better, before the situation gets too close to the edge (end of political rant).