Chart Art: USD/JPY Triangle Tightens Ahead of BOJ Decision


USD/JPY’s 4-hour triangle nears its apex, with Friday’s BOJ decision set to test support and potentially trigger a breakout higher.
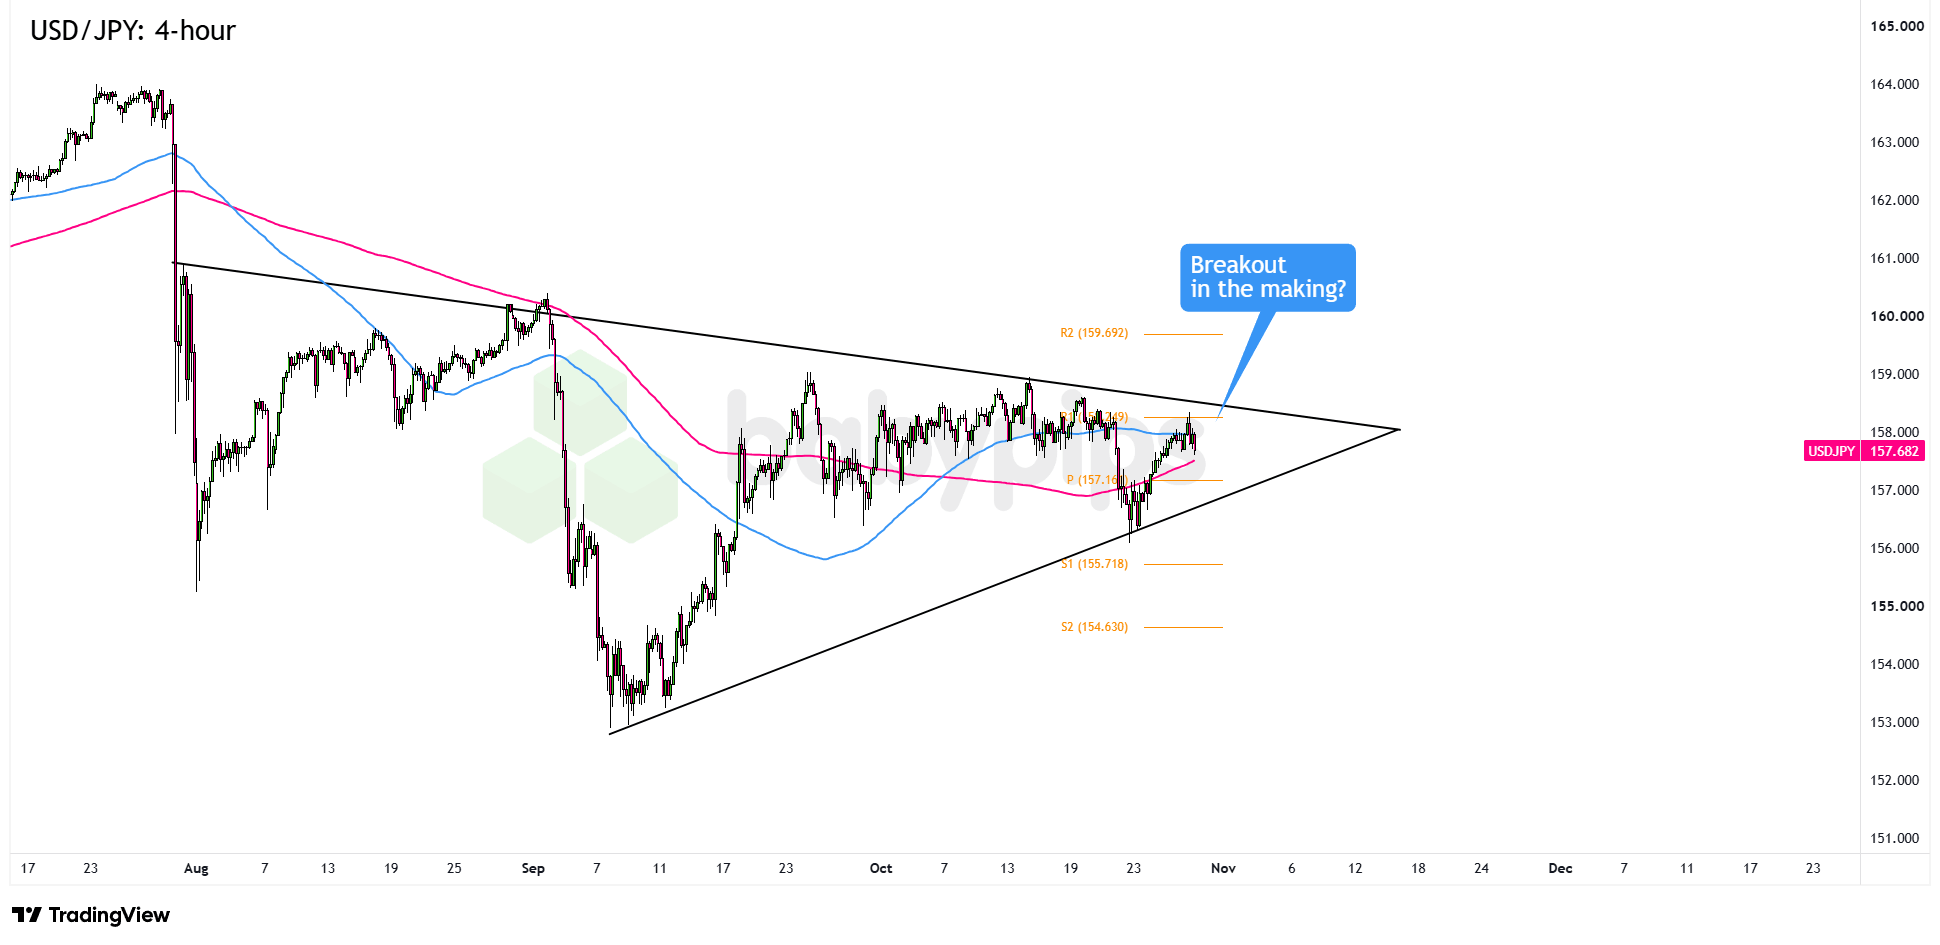
USD/JPY is tightening into a 4-hour triangle ahead of tomorrow’s BOJ decision.
Will hawkish guidance or another cautious message from Ueda break the stalemate?
Here are the key levels to watch.
USD/JPY: 4-hour
The Federal Reserve held its benchmark rate at 3.75% to 4.00% in a 10-2 vote Wednesday, but Chair Warsh’s press conference fell short of the hawkish punch traders were looking for, leaving short-term Treasury yields eased and the dollar on the back foot for most of the session.
The BOJ is expected to hold its policy rate at 1.25% on Friday. Markets will be watching for the Bank’s view on whether underlying inflation has reached its 2% target, and whether Governor Ueda keeps a December hike on the table.
USD/JPY has been forming a symmetrical triangle on the 4-hour chart since rebounding from lows near 153.00 in early September. Lower highs and higher lows have squeezed price toward the triangle’s tip near 157.60.Just below, the Pivot Point at 157.16, the 200 SMA, and the rising lower trend line are converging to form support. The falling upper trend line near 158.00 has capped recent advances.
September’s BOJ decision is a useful reminder that the yen can react more to Governor Ueda’s comments than to the rate decision itself. The BOJ’s 7-to-2 vote to raise rates to 1.25% looked hawkish, but Ueda’s cautious tone sent the yen lower and USD/JPY back toward 158.00.
Watch for bullish candlestick patterns near the upper trend line. They could signal that buyers are stepping in and a breakout may be approaching. A sustained move above 159.00 could open the way toward R2 at 159.692, with the 160.00 psychological level as the next major target.
If USD/JPY breaks below the rising trend line, the Pivot Point at 157.10, and the 200 SMA, sellers could target S1 at 155.718. If selling continues below 156.00, S2 at 154.630 could come into view.
Whichever bias you end up trading, don’t forget to practice proper risk management and stay aware of top-tier catalysts that could influence overall market sentiment.
Related Articles
- Forex News
Chart Art: CHF/JPY Hovers Above Triangle Support Ahead of BOJ
- Forex News
Dollar rebounds as euro slips ahead of key central bank decisions
- Economy News
BOJ preview October: hawkish hold expected as inflation remains sticky
- Stock Markets News
Japan services PPI preview: 3.7% pace in focus ahead of Friday’s BoJ decision
- Stock Markets News
Japan September services PPI holds at 3.7% y/y, in line with forecast, before BoJ