Chart Art: Gold (XAU/USD) Reversal in the Works?


Gold recently broke above a longer-term trend line and appears to be forming a reversal pattern on its 4-hour chart.
Any chance of seeing confirmation soon?
Check out these inflection points and potential targets!
Gold (XAU/USD): 4-hour
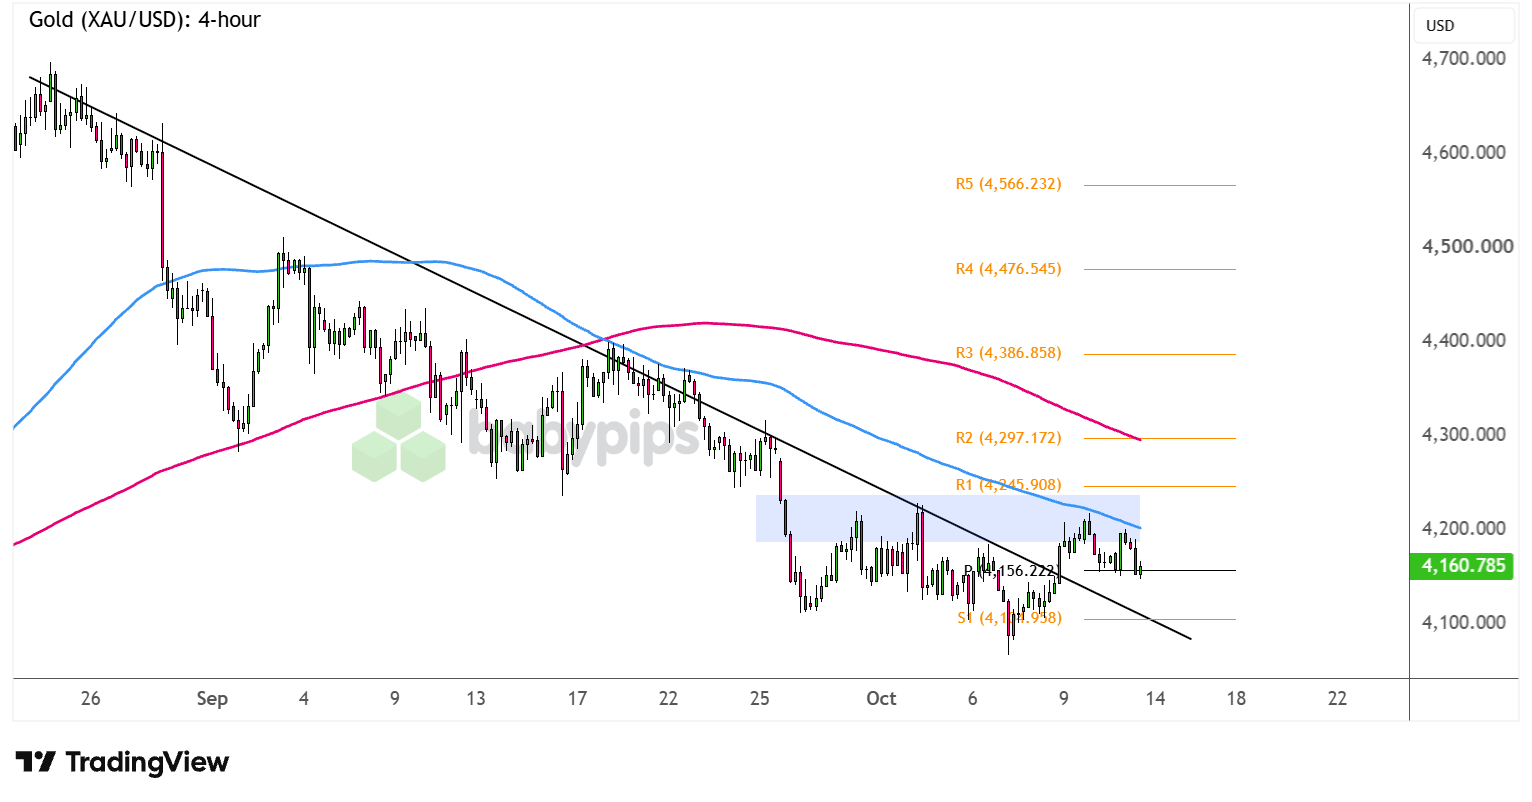
The precious metal appears to be pulling up from a months-long slide, as it rallied above a descending trend line that had been capping gains since late August.
Price is stalling from its breakout but is also finding some near-term support around the pivot point ($4,146.22).
Are gold bulls ready to charge from here?
Gold has been putting up a good fight against the strengthening U.S. dollar thanks to safe-haven flows stemming from elevated Middle East tensions, as markets remain nervous about a possible U.S. strike on Iran.The upcoming U.S. CPI release could still determine whether or not XAU/USD can gain traction on its climb, potentially completing an inverted head and shoulders pattern around the $4,200 neckline if the numbers disappoint.
Sustained bullish momentum past the area of interest could take gold up to the next bullish target at R1 ($4,245.90) then R2 ($4,297.17) near the $4,300 major psychological resistance and 200 SMA.
On the other hand, another strong U.S. inflation print and hawkish commentary from Warsh could extend the precious metal’s selloff to the recent lows at S1 ($4,104.95) or lower.
Whichever bias you end up trading, don’t forget to practice proper risk management and stay aware of top-tier catalysts that could influence overall market sentiment!