Solana holds above $100 as ETF outflows and falling OI weigh on recovery


Solana held above $100 on Monday, but persistent ETF withdrawals and declining futures exposure kept its near-term outlook under pressure.
SOL traded around $101.45 after posting three consecutive weekly declines, including a 2% loss last week.
The token remains below its 50-day Exponential Moving Average, while longer-term support near $98 provides an important test for buyers.
Despite a recent network upgrade, market demand has yet to show a sustained improvement.
Solana ETFs record third consecutive week of outflows
Solana-focused exchange-traded funds registered $17.30 million in net outflows last week, marking their third straight negative week, according to SoSoValue data.
The withdrawals brought the monthly total to $72.24 million, highlighting continued redemptions from investment products linked to SOL.
Persistent ETF outflows suggest weaker demand through those products.
However, fund flows alone do not establish the identity or motivations of every investor reducing exposure.
The continued withdrawals leave Solana without a stronger source of fund-related buying support as its price approaches a key technical level.
Solana’s derivatives market also shows signs of cooling activity.
CoinGlass data puts SOL futures open interest at $6.27 billion on Monday, down from $6.34 billion last week. That represents a decline of approximately 2% in the dollar value of outstanding contracts.
The decrease is consistent with reduced leveraged exposure, although falling spot prices can also lower dollar-denominated open interest.
The figures alone do not establish whether retail traders are responsible or whether positions were closed voluntarily or liquidated.
Together with ETF redemptions, the data suggests a cautious trading environment.
The weakness persists despite last week’s Alpenglow upgrade. The update replaced TowerBFT with a new consensus engine, Votor, targeting a reduction in transaction finality from roughly 12 seconds to 150 milliseconds.
That technical development has yet to translate into a sustained price recovery.
Solana approaches support at the 200-Day EMA
SOL remains below its 50-day EMA at $105.99 but above its 200-day EMA at $98.27. This positioning leaves the near-term trend weak while preserving an important element of its longer-term structure.
The psychological $100 threshold is the immediate reference, with the 200-day average providing the next meaningful technical support.
A confirmed break below $98.27 would weaken that structure and could expose the rising support trendline near $86.67.
Momentum indicators reinforce the cautious outlook. The daily Relative Strength Index stands at 36.83, showing subdued buying strength while remaining above the conventional oversold threshold.
The Moving Average Convergence Divergence line is slightly below its signal line in negative territory, indicating that downside momentum remains in place.
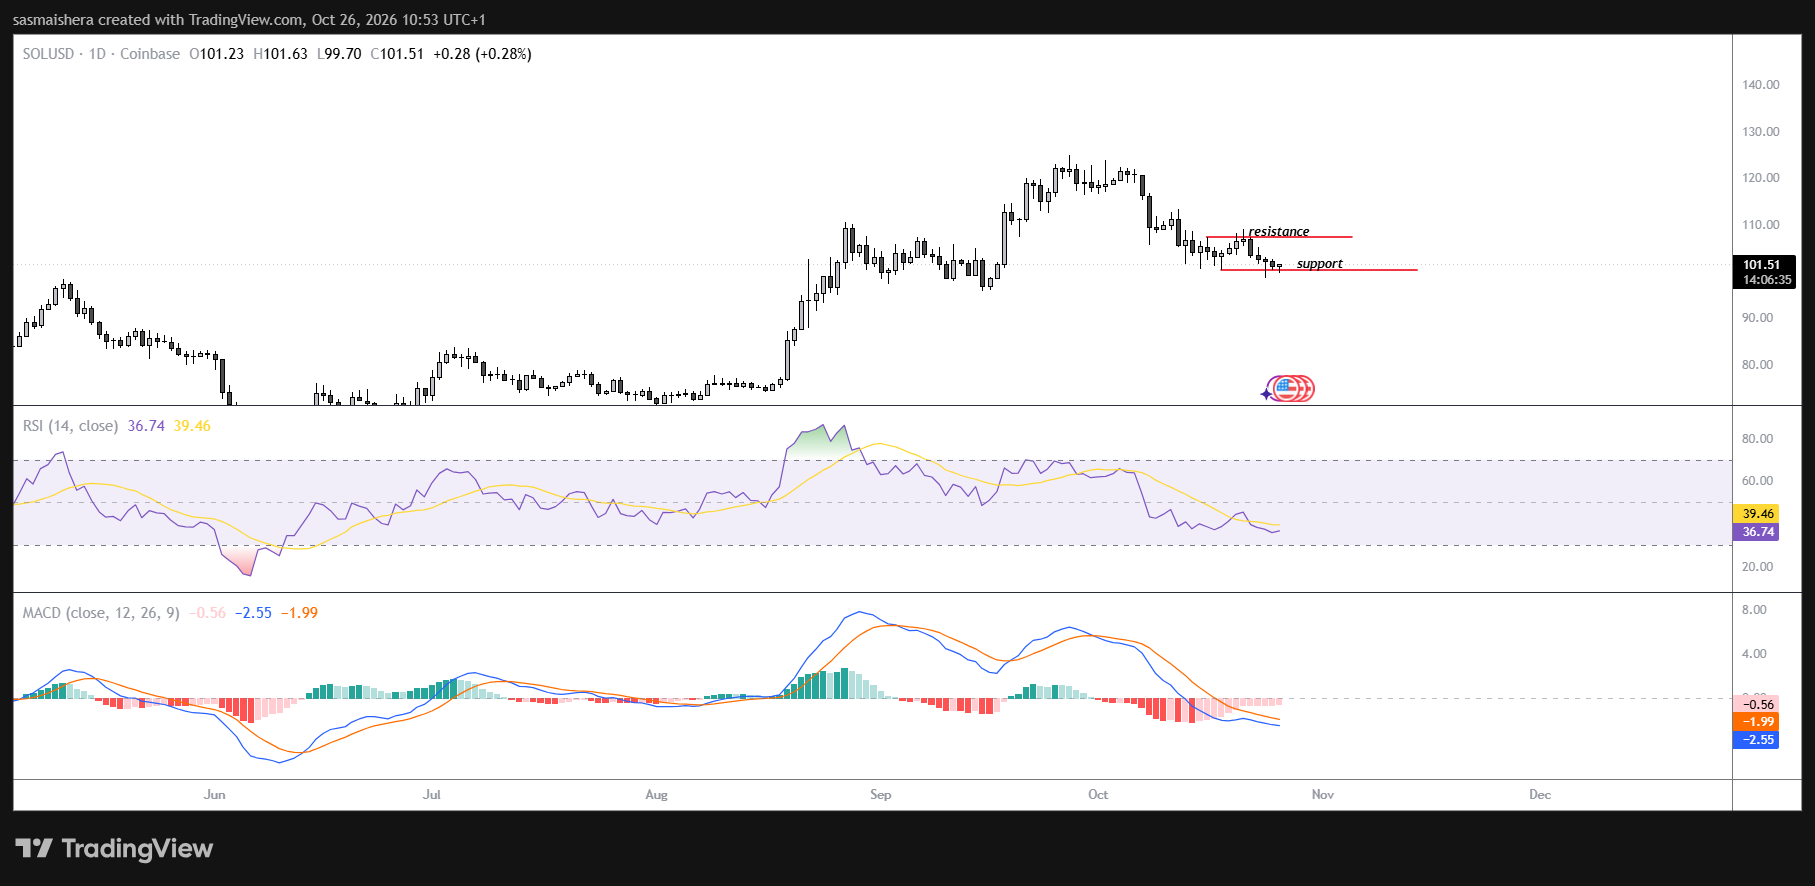
For a recovery to gain traction, Solana first needs to overcome the 50-day EMA near $107.33.
A sustained move above that level would ease immediate selling pressure and improve the short-term technical picture. Beyond it, the September 25 high at $122.94 represents a more distant resistance level.
Until momentum strengthens, SOL’s ability to defend the $100 area and the nearby 200-day EMA remains central to its outlook.
Continued ETF withdrawals and softer derivatives activity could make that support harder to maintain.