Bitcoin gets $1 billion in ETF inflows, yet can't crack $84,000: what's wrong?


Bitcoin has lost its momentum after rallying above the $84,000 mark on Wednesday. The world’s leading cryptocurrency by market cap is down by 0.3% over the past 24 hours and is now trading below $82,500.
The bearish performance comes as the bulls failed to push past the resistance level above $84,000.
Technical indicators suggest that the bears could push Bitcoin’s price towards the key support level at $79,676 in the near term.
Bitcoin buyers failed to push the price higher
Bitcoin showed signs of recovery on Wednesday as derivatives positioning improved and buyers continued defending the lower end of its recent trading range.
However, a concentration of sell orders and liquidation levels above $84,000 and near $87,000 complicated further gains.
The recent recovery was supported by futures open interest across major exchanges climbing 4.2% from its October 12 low to $52.60 billion by October 20.
The OI has increased to $53.66 billion over the last 24 hours but has failed to push Bitcoin’s price above the $85,000 level in the near term.
Despite Bitcoin’s price retracement, the long-to-short ratio stands at 1.0133. A ratio above 1 indicates that the bulls are currently in control of the market.
The decline over the last 24 hours could be as a result of traders anticipating Friday’s options expiry.
The options expiry carries approximately $1.23 billion in notional open interest, with a maximum pain price near $82,000.
That level represents the expiry price at which aggregate option-holder payouts would be lowest; it does not guarantee where Bitcoin will trade.
The larger October 30 monthly expiry accounts for $11.2 billion in notional open interest. Its implied one-standard-deviation range extends from $78,300 to $87,100, placing the upper boundary close to the overhead selling zone.
US spot Bitcoin ETFs attracted approximately $526 million on Monday, followed by another $528 million on Wednesday, their largest daily net inflow since September 22. The intake helped turn weekly flows positive, although ETF trading volume remained subdued.
With Bitcoin failing to take out the key resistance level below $85,000, traders would be watching to see if the support just below $80,000 holds in the near term.
Bitcoin technical outlook: Bulls look to defend the $79,676 support
The BTC/USD 4-hour chart remains bullish and efficient as Bitcoin has been ranging between the $84,000 and $80,000 levels.
The leading cryptocurrency by market cap failed to surpass the sell wall around $84,261 on Wednesday and has now dropped below $82,400.
The technical indicators suggest that the market lacks real directional bias in the near term. The Relative Strength Index (RSI) reads 56, just above the neutral 50, while the Stochastic reading stands at 53.
The MACD lines are also close to the neutral level. The three indicators suggest that the buyers remain in control, but the bullish momentum is waning.
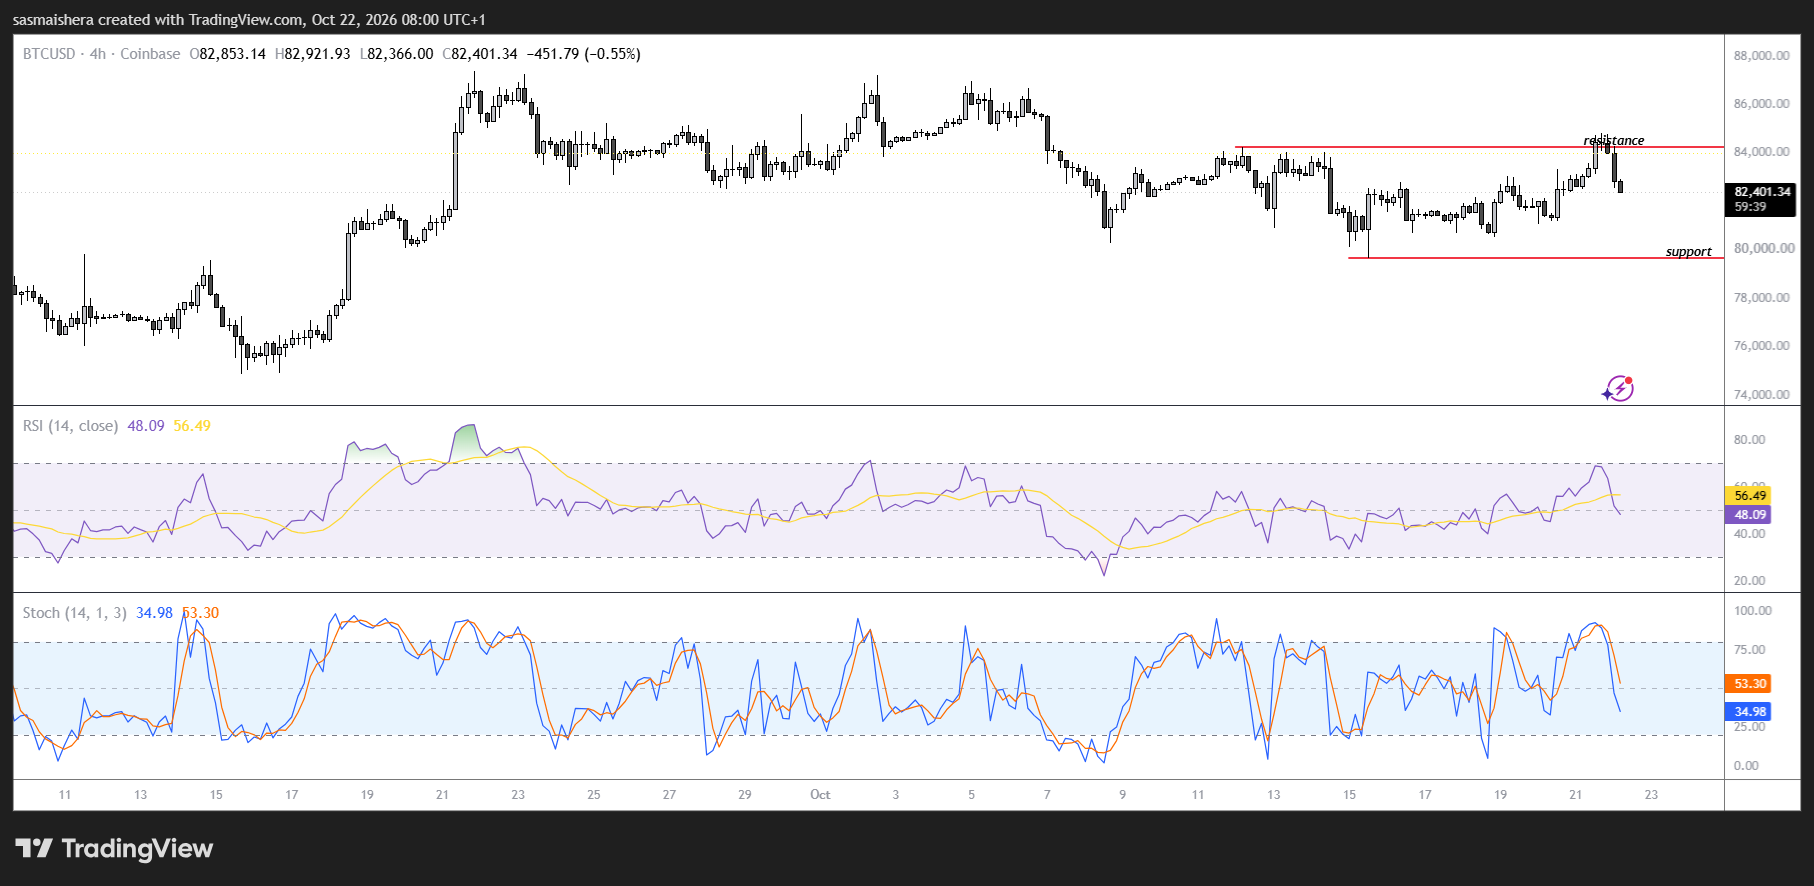
If the selloff continues, Bitcoin could drop below $80,000 and test the $79,676 support level once again.
This support level has held firmly during the last three pullbacks. If it holds, it would allow the bulls to push higher towards the $84,261 resistance level once again.
A decisive daily candle close above this resistance could bring the $87,000 sell wall into focus.
For now, Bitcoin seems to be ranging between $84,000 and $80,000, with no clear directional bias.