Bitcoin drops 18% in seven days, breaking its summer low

Bitcoin traded near $55,935 on Nov. 21, down roughly 18% from its Nov. 14 opening level, as a sell-off in AI stocks spilled into crypto and investors pulled money from U.S. spot Bitcoin ETFs. Bitcoin loses its summer floor as…

Bitcoin traded near $55,935 on Nov. 21, down roughly 18% from its Nov. 14 opening level, as a sell-off in AI stocks spilled into crypto and investors pulled money from U.S. spot Bitcoin ETFs.
Summary- Binance’s BTC/USDT pair touched $55,130, below Bitcoin’s previous summer low near $57,700.
- U.S. spot Bitcoin ETFs lost $582.3 million on Nov. 19, with BlackRock’s IBIT accounting for $541.1 million of the net outflow.
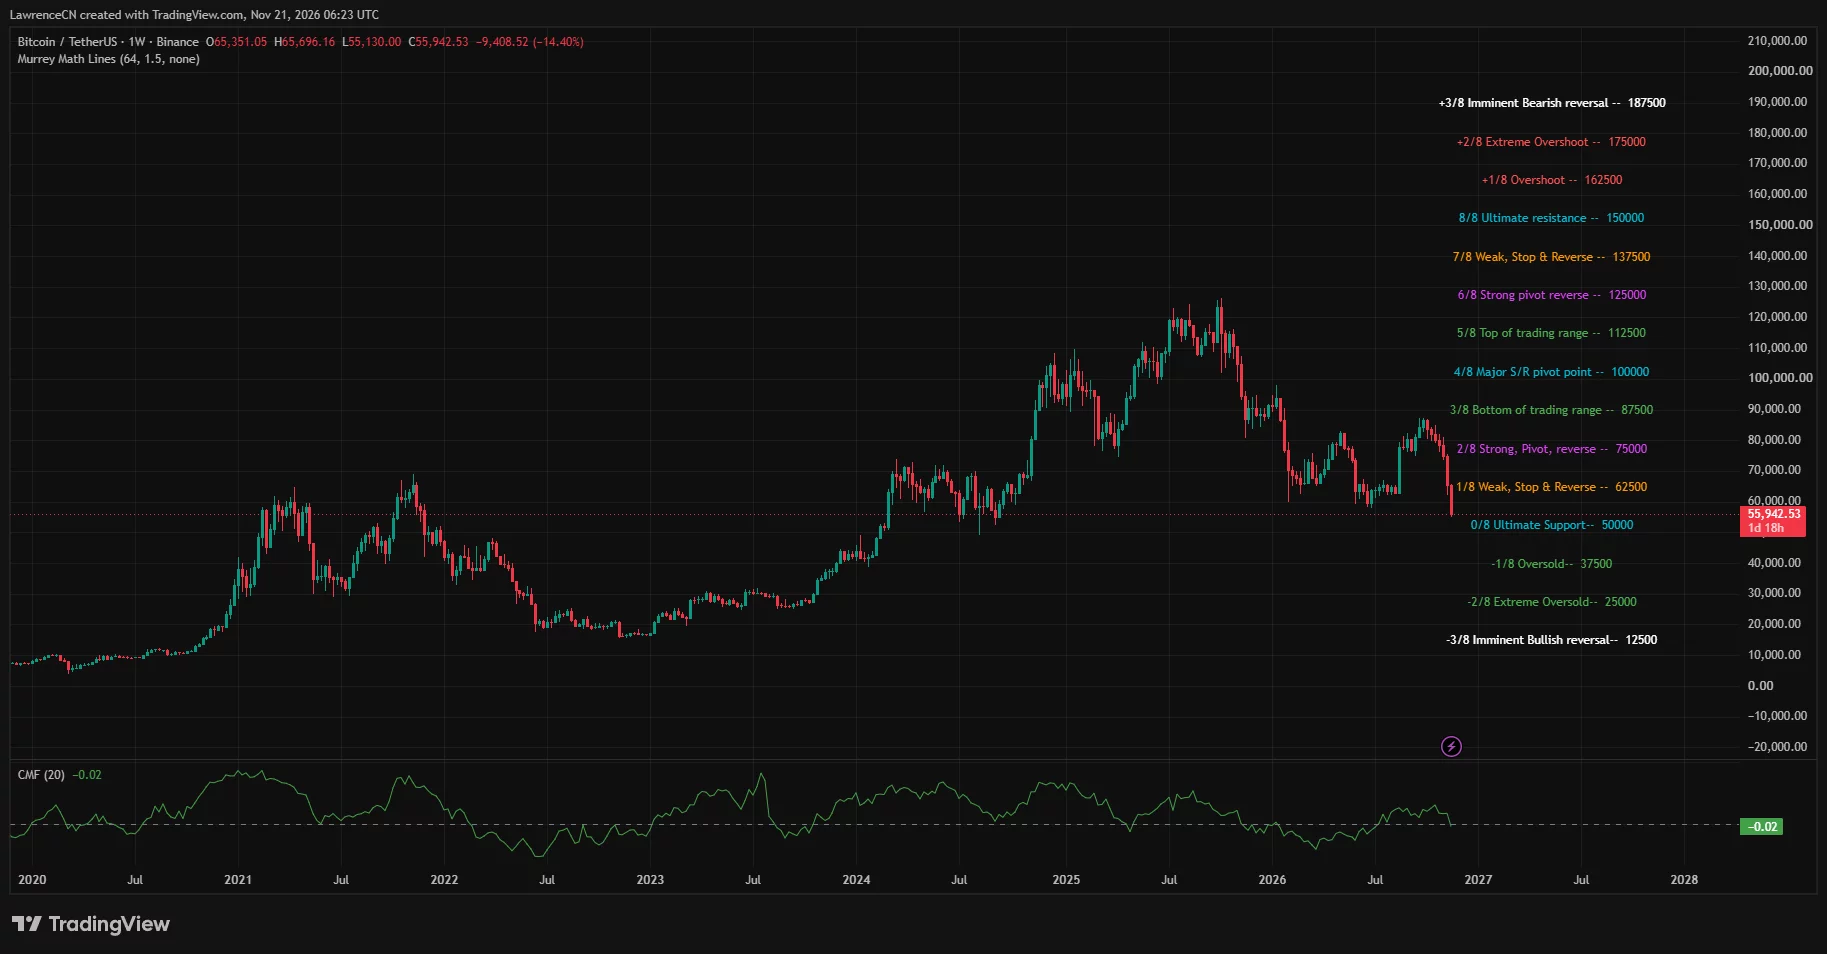
- Bitcoin’s weekly chart put the next lower Murrey Math level at $50,000 after the price fell through $62,500.
- CoinGlass recorded about $495 million in Bitcoin long liquidations on Nov. 20, roughly 92% of the day’s Bitcoin total.
Bitcoin loses its summer floor as tech stocks slide
Bitcoin began the seven-day stretch near $68,250 on Nov. 14 and spent several days trading around $63,000 to $65,000. The decline picked up again as the price slipped through $62,000 on Nov. 19. By Friday, Bitcoin had fallen below $60,000 for the first time since July.
Its move through $57,700 the following day erased the rebound from the summer low. At 06:22 UTC on Saturday, Binance’s daily chart showed Bitcoin down 5.12% from the prior daily close.
The latest decline coincided with a pullback in tech stocks after Anthropic’s Nasdaq debut on Nov. 19. The AI company priced shares at $83, and the stock closed its first session at $97 before giving back part of that gain on Friday. Bitcoin miners also came under pressure.
IREN, which operates Bitcoin mines and sells AI cloud computing services, was down 11.1% in a Friday intraday snapshot, while MARA was down 9.4% in a separate snapshot.
The stock sell-off came as investors were already weighing the prospect of higher U.S. interest rates. The October CPI rose 0.4% from September, with shelter accounting for more than 30% of the monthly increase. Higher rates make it more expensive to borrow and raise the return investors can earn on cash, increasing the cost of holding assets such as Bitcoin that pay no interest.
U.S. spot Bitcoin ETF outflows top $3.4 billion
U.S. spot Bitcoin ETFs recorded about $3.47 billion in net outflows from the start of November through Nov. 19, based on Farside Investors data. The funds took in $7.9 million on Monday, Nov. 16, before losing a combined $1.13 billion over the next three sessions. BlackRock’s IBIT accounted for about 93% of Thursday’s net outflow across the group.
Thursday’s outflow was larger than the combined $546.4 million withdrawn on Tuesday and Wednesday. It also exceeded the $411.9 million pulled from the funds on Nov. 6, when redemptions had already begun to build. Fidelity’s FBTC lost $45.9 million on Thursday, while Morgan Stanley’s MSBT added $49.6 million, the largest inflow among the funds that day.
The withdrawals came as existing ETF investors were already sitting on losses. Bitfinex estimated the average entry price for ETF holdings and put Bitcoin nearly 25% below that level before the latest leg down. The exchange said a price recovery could give some holders an opportunity to reduce their exposure.
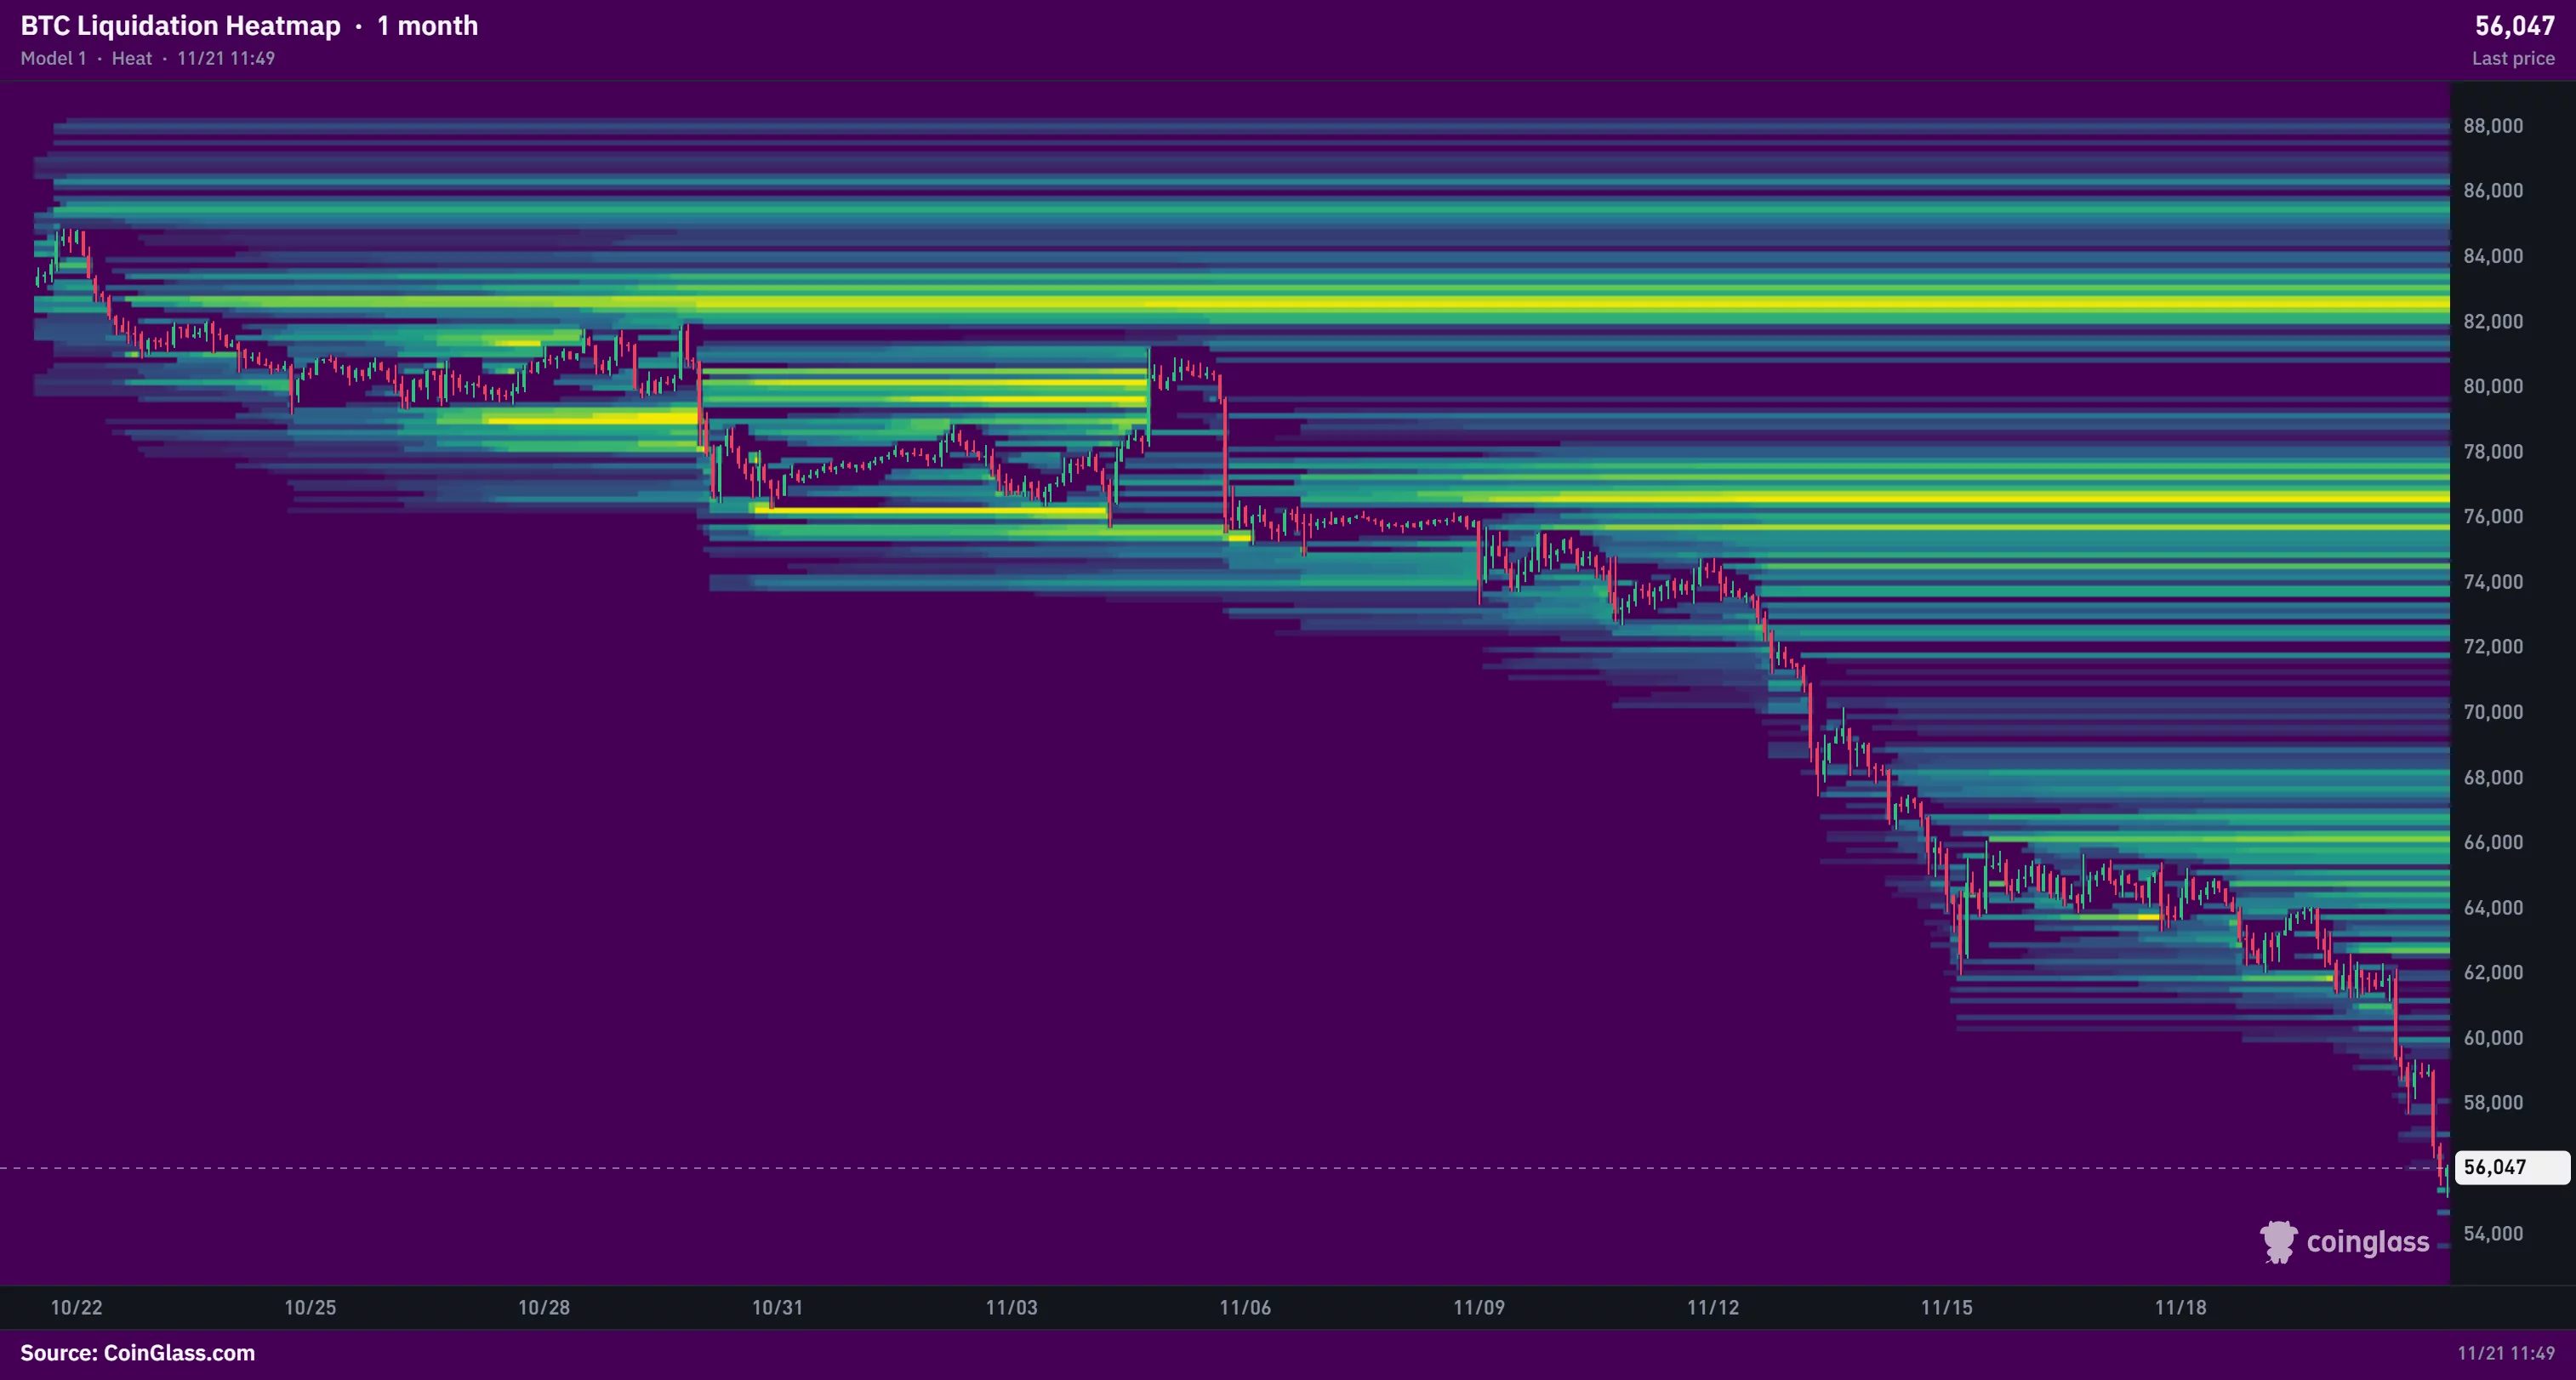
Leveraged traders also took losses as Bitcoin fell through $60,000. CoinGlass data put Bitcoin liquidations at about $538 million on Nov. 20, including $495 million in longs. The one-month heatmap showed potential liquidation clusters above Saturday’s price around $62,700 and $66,000. A recovery into those areas could put pressure on traders who borrowed to bet on further declines.
Bitcoin charts put $55,130 in focus
The daily chart showed Bitcoin trading just below its lower Bollinger Band at $56,231. The Average Directional Index rose to 46.93 as prices fell, pointing to a strengthening downtrend. A move back inside the band would put the old summer floor near $57,700 in view, followed by $60,000, where Friday’s sell-off accelerated.
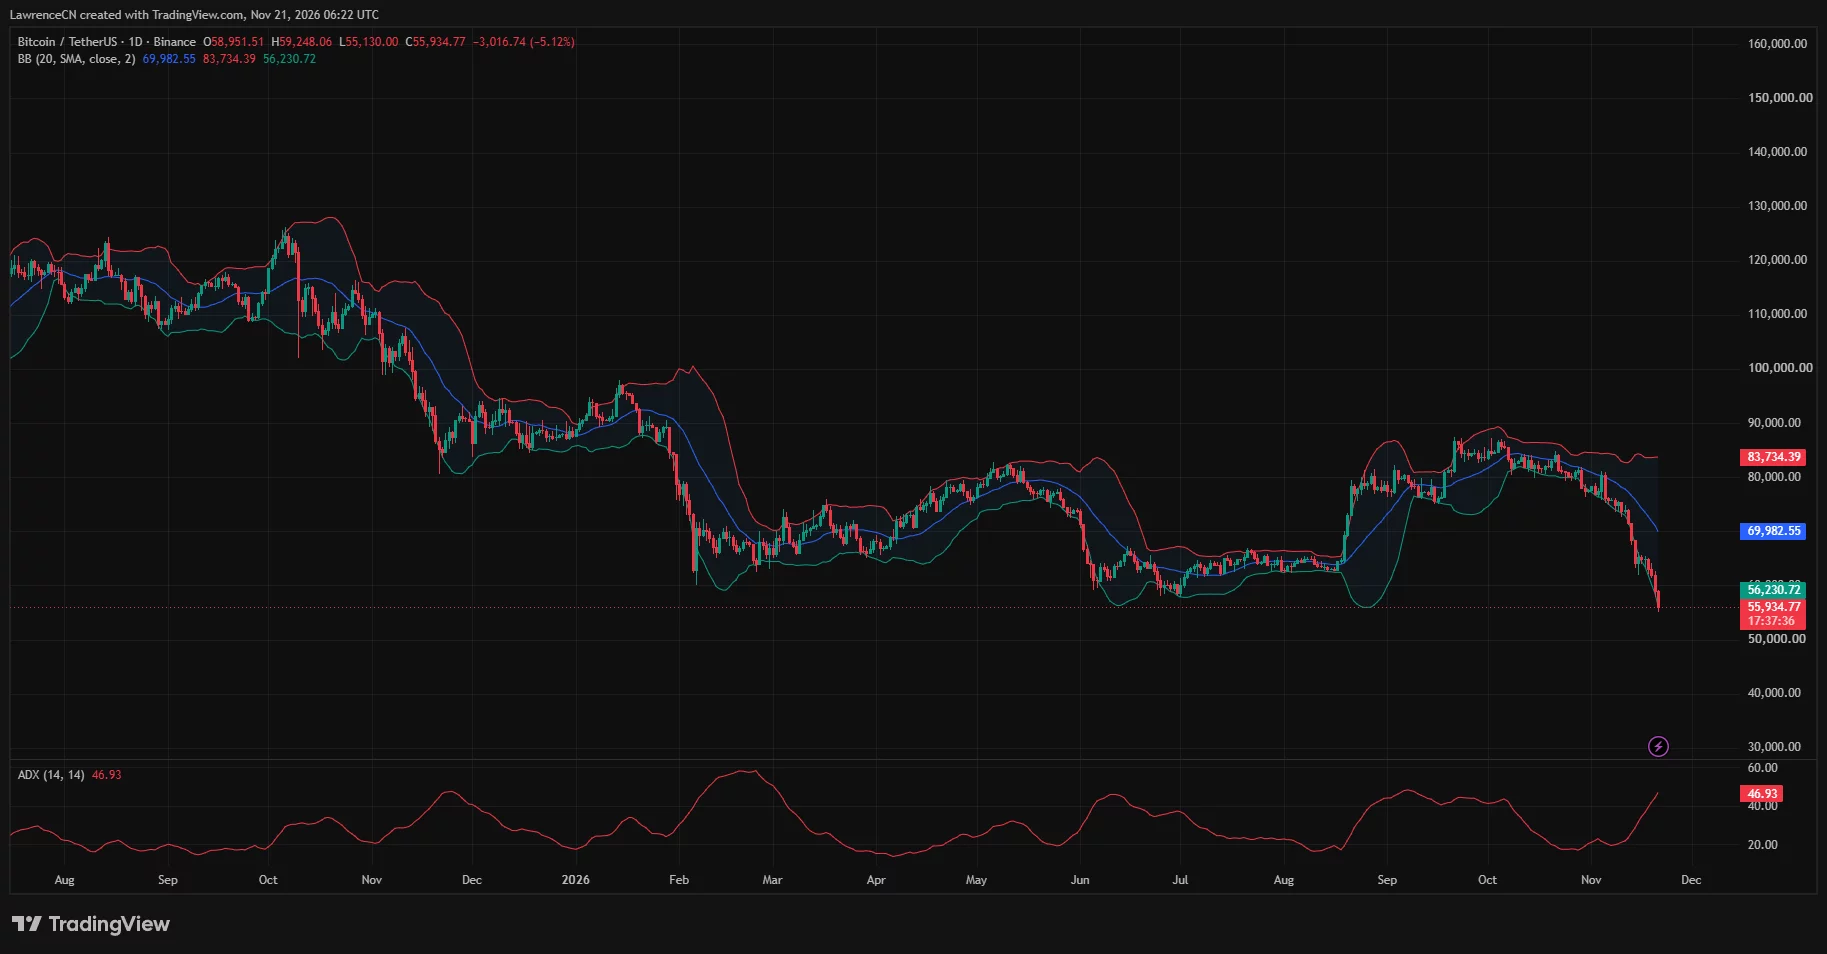
The lower band sat within about $300 of the daily chart price, while the 20-day average was near $69,983. That leaves room for a rebound inside the bands while Bitcoin remains well below its recent average. At Saturday’s chart price, even a return to $60,000 would take a gain of roughly 7.3%.
On the weekly chart, Bitcoin was down 14.4% from the candle’s opening level near $65,351, with the candle still open on Saturday. Weekly Chaikin Money Flow stood at minus 0.02, just below neutral. The price was also below the $62,500 Murrey Math line, with the next level on that indicator at $50,000.
Market commentator Jesse Olson had outlined a longer bear-market scenario in August if Bitcoin stalled near $82,000, failed to make a higher high, and broke its rising trendline. He said at the time that he thought the scenario would require a roughly 30% stock market correction. In a separate August post, Olson had outlined a bullish scenario based on a weekly buy signal.
Bitcoin remained below the summer floor on Saturday morning. A break beneath the $55,130 session low would leave $50,000 about 9% below that low on the weekly chart. A recovery above $57,700 would reclaim the floor that held through the summer.